Bostoners are an imaginative bunch, having mass-produced dozens of ways of running afoul of their city’s housing code. And iIf you doubt me, run this singular field through a pivot table:
Row Labels: Description
Values: Description (Count, of course – the field is text-formatted)
154 different alleged violation types proceed to alphabetize themselves down the column, and hereby an elementary presentational problem is posed – along with some less-than-self-evident collateral issues.
The problem asks after the advisability of keeping all 154 in view, and its challenge to legibility, and/or reader stamina. Of course the actual numbers could be sorted, Largest to Smallest (just right-click atop the numbers and look for Sort), but whether the eyeballs you hope to divert your way are prepared to scroll all the way down the 68 offenses cited exactly once remains a good editorial question – so if you’re looking for a crisper take on the data, try the Top 10 filter option.
Top 10 grants the user an easily-realized means for identifying the top, or bottom, 10 – or any number you designate, in fact – values punctuating the data. Here you need only right-click anywhere among the Row Labels (and not in the Values area itself; yes, I’ve messed this up, too), and click Filter> Top 10…
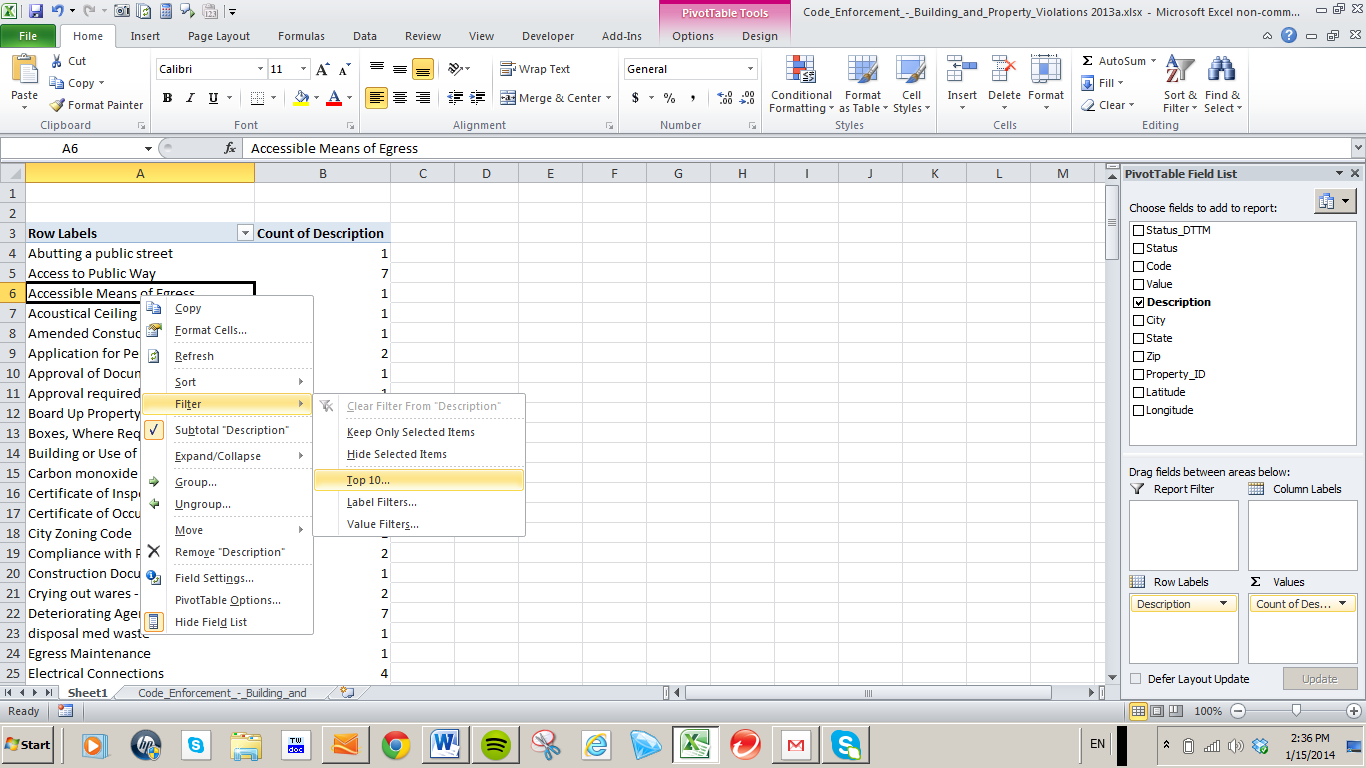
When you wind up here
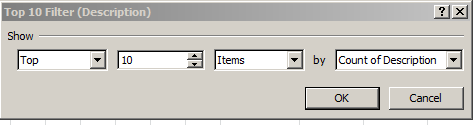
You can probably figure out where to take the dialog box next; and in fact, if you do want to mark off the 10 commonest violations (and by clicking the down arrow attending the third field now showing Items you can also harness a specified top or bottom percent of the records, and sum the selected records as well) – and as you’ll see, there’s very good reason to do so – just leave all the above defaults as you see them above, and click OK. You’ll then discover that Top 10 won’t sort the remaining values, though; you’ll have to do that all your own:
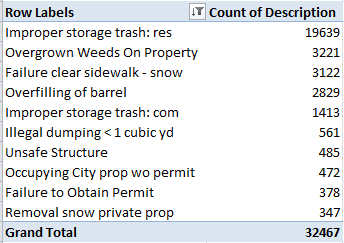
No clairvoyant am I, but a confining of the violations to just their top 10, which account for 93% of all complaints, seems a rather sage and efficient strategem – and it reads better, too. We see that the citywide scourge, the Improper store trash: res trespass, contributes 56% of all citations alone. (Note here that any Save As calculation, e.g., % of Column Total, will slide the 32467 top-10 grand total into the denominator’s space, and not all the 34881 violations. Note too that when and if you want to override the top 10 mode and restore all the data, right-click on the Row Label/Description area again and click Filter > Clear Filter…).
Now here’s an important tip, expandable beyond Boston’s borders. One might, for example, take in interest in tabling the violation case closure rate by month – that is, the percentage of complaints reaching some resolution, however that status might be conferred. The plan seems simple enough: introduce Status_DTTM (the date-time-bearing field) say, to Column Labels, and group these by month, roll Status into Row Labels, and sock in Status again, this time in the Values field, in order to count the respective Open and Closed outcomes. The problem is in the very fineness of the Status_DTTM data, whose entries drill down to both time of day and day of month. If you lift Status_DTTM into Column Labels you’ll be told:
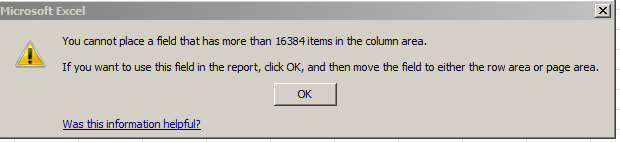
The proscription is clear; you can’t string more than 16,384 data points across a pivot table’s Column span, and our data comprises more than that. But there is a workaround, though: repatriate Status_DTTM into Row Labels, group it by month there, and then sneak it back into Column Labels and show the values as % of Columns Total. Twelve data points will fit (and I’d also turn Grand Totals on for Rows Only).
In any case, when the hurly burly’s done I get
![]()
Complaints filed later in the year unsurprisingly exhibit the lower closure rates, the rate spiking in October; but the August figures run curiously against the grain. Moreover, if you deactivate % of Rows and resort to the default No Calculation (that is, PivotTable Tools > Options > Show Values As > No Calculation, you’ll see
Anyone care to explain why August’s closing rate falls beneath September’s, positioned later in the year and reporting far larger violations besides? Put simply, I don’t know; but those in search of a story angle have just found one, I think.
Now what if we break out violation types by time of day (again, as per last week’s post, I’m assuming these are times at which the apparent violation actually came under enforcement agent scrutiny)? Click in the Column Labels area, get back to Group Selection, and click Hours while deselecting Months. Exchange Description for Status in Row Labels, and filter the top 10 again and sort these:
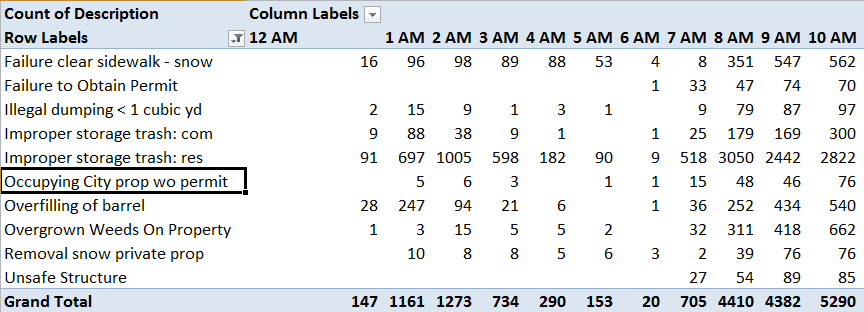
Note each Column’s hourly totals (the above shot excerpts the entire table). So whatever you do, don’t store your trash improperly at 10 AM; that’s when the long arm of the law is most likely to get you in a headlock.

Leave a comment