DalYou may not need or want to know that you’re the world’s 1572nd best plyer of your favorite trade, but tennis plyers, er, players, can’t help but be reminded of precisely where they stand among their peers, and all the time at that. It’s the rankings, those invidious markers of professional worth that want you to know just how many of your fellow practitioners out there do your job better than you do; and the Tennis Abstracts site ranks 2100+ male players on the Association of Tennis Professionals (ATP) tour for your interest, consideration, and analysis (I don’t see an equivalent compendium for the woman’s tour, by the way, though other sorts of listings for them are on the site). You can check it out in standard spreadsheet form courtesy of yours truly here:
The data set comprises exactly four fields, one of which – the player names – doesn’t really have that much to add to the inquiry, though I wouldn’t I delete it. But those three other fields nevertheless suffice to speak instructively about the rankings.
First, a necessary qualification: we need to recognize that, with its December, 2014 timestamp, the rankings – which naturally oscillate with every tournament – aren’t absolutely to-the-minute, an imperfection that is real and should be rued. You’ll happen upon a timelier arraying here at the ATP web site, but its currency is frittered away by the site’s poorer data organization: the players come to screen in blocks of only 100 at a time, and their country codes have been supplanted by text-less national flag icons, which don’t copy-and-paste very well at all, if at all. And that means you have to know your flags.
Shortcomings duly recorded, we can return to our data and attempt a breakout of ranked players by country, an obvious but need-to-know kind of metric. And here too another problem of sorts sprays molasses into the gears: those aren’t flags in there, but I can’t always tell which country is referenced by which three-letter code. It took me a round of Googling, for example, before I persuaded myself that MNE means Montenegro, BIH stands for Bosnia-Herzegovina, and MAR is, naturally, Morocco (ok – it’s Maroc in French; look here for some global clarifications). And CHI is Chile, not China; that latter country is signified by CHN.
But once you get past that international complication this straightforward pivot table beckons:
Row Labels: Country
Values: Country (Count)
Country (again, here % of Column Total). Sort by either Count of Country values, largest to smallest. I get in excerpt:
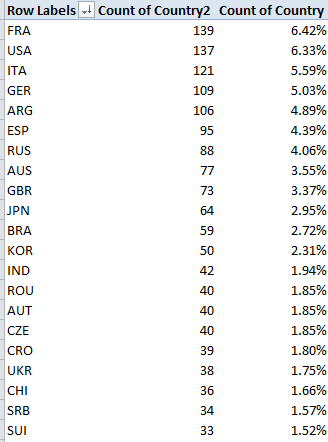
Quelle surprise. I would not have anticipated France’s superior representation, or Italy’s third-place showing but I’m a duffer; followers in the know may find their expectations wholly fulfilled.
But what about the countries’ numbers and their players’ average rankings (whereby lower is better)? Let’s slide Country into Values, summarizing by Average and formatting to two decimals, e.g.:

Leaving existing sort order in place, we again find the French among the higher achievers. Remember that with 2166 players populating the ratings, the average across that total comes to 1033.5; and so an evaluation of 844.46 – 189 places above the average – spread across 139 Frenchmen, is no small attainment (note that some players with equivalent, overall tournament point totals will share a ranking. Thus if two players are ranked 83, the next player down the pecking order receives an 85).
The problem of course is that the average reported above won’t directly reconcile absolute country totals with the calculation. We see, for example, that Czechoslovokia ‘s average 799.78 rank outpaces France’s appreciably, but it’s gotten there with but 40 players – and that disparity seems to shortchange the latter country. Thus it seems to me that dividing a country’s number of ranked players by its average rating – again, in which lower is better – would realize a truer measure of the national standings. Not perfectly true, perhaps, but truer.
That alternative would appear to call for a calculated pivot table field, something like this:
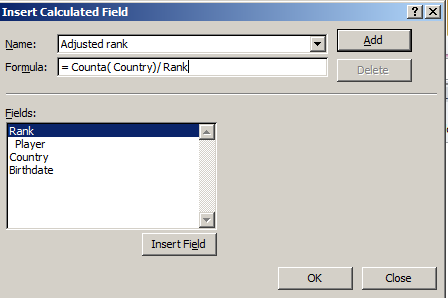
But that won’t work at all, in part because, to quote Excel boffin Debra Dalgliesh:
“A calculated field always uses the SUM of other values, even if those values are displayed with another function, such as COUNT.”
You may want to think about that caution – I know I need to –but either way, you can’t build a calculated field atop a set of counted values – and country names can only be counted. The way in to a solution then, would return us to the data set itself, to which we need to strap in another field, which I’ll call Country Count, presumably in column E. I’d then select all the country data in C2:C2167, name that range country, and in E2 enter:
=COUNTIF(country,C2)
and copy down E, even as you blunt the values’ two decimals if you see them. As advertised, the COUNTIF totals respective incidences of each country name, and don’t be bothered by the fact that the total won’t vary among countrymen down the column. For example, the appropriate E cell for each French player will return 139, but that redundancy will be attended to by the ensuing pivot table, which should assume this shape:
Row Labels: Country
And it’s here where we devise the calculated field, which I’m calling AdjustedRank, e.g.:
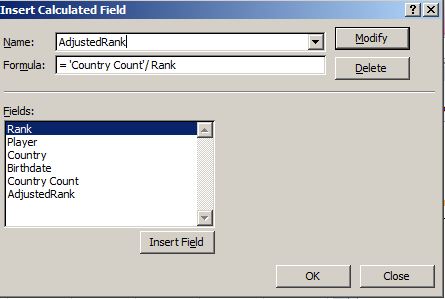
Click OK and sort by AdjustedRank, Largest to Smallest (here I’ve formatted the results to six decimals):

That’s a bit more like it, I think. Compare France’s adjusted rank with Czechoslovakia’s; now, in spite of the latter’s more impressive average rank, France’s greater player numbers overwhelm that advantage commensurately, at least more or less.
I’m hedging because, taken to its limiting case, my new field begins to cause itself problems. 21 countries contributed exactly one player to the rankings; if one of those players, for illustration’s sake, were rated number one, my little equation:
=Country count/Average ranking
Would yield 1, and so would embarrass France’s real-world, table-topping .164602. That scenario isn’t unimaginable, either, and so the above fraction might have to be returned to the shop for a rethink, the better to properly mathematize all contingencies.
OK, so my calculated field isn’t irreproachable. But I ask you: can 139 Frenchmen be wrong?

Leave a comment