Honk if you’re still with me, and watch as I capitulate in abject surrender to a data-manipulative chore that may, in view of my inconsiderable resources and like willingness, seems to be booming too much noise into my cost-benefit analysis. As you know, I’ve been spending the last 2300 words or so chasing after a universal fit, a formula that would return each and every ride duration in the New York green cab data set.
An honorable intent, but perhaps a prohibitive one. I’ve been spinning that task through a battery of permutations that could stand up to every data entry pothole opening beneath my tires, but the chassis is starting to rattle.
The problem can be synopsized here:

It is clear that the first ride took all of five minutes (apart from the day discrepancy, which has been earlier addressed), but again, because the data set insists on dragging that 1:00 into the morning hours the ride computes to a 11:55 travel time. The third screen shot record, however, points to a straightforwardly plausible result; subtract one time from the other there (remembering the ABS emendation) and you get eight minutes. Both cases, however, describe a ride starting in the morning and dropping its customer off in the afternoon; and the formulaic stipulations that would unerringly deliver the right and proper number in each and every case might require a Part 4 and 5 here, and short of a contract from New York’s Taxi and Limousine Commission I’m not all the way gung-ho about the mission.
Ok, I’m a slacker, but I’m in the interests of exposition I’ll bare a cold shoulder to the task and look for other, more justifiable prospects among the data.
But before I move ahead the obvious question needs to be asked. Is there a larger point to be made about all this? Of course there is, albeit a wholly platitudinous one. Data need to be checked if they are to be used, because as a matter of effective definition that’s what data are about. One assumes that the Taxi Commission is entirely capable of putting the data aright, and if their open data is to be worth opening its accessors need to be able to make something of them, after all. It’s easy to be critical, of course, and 300,000 records are likely to incur a measure of slippage; but there are permissible and impermissible tolerances to be abided, it seems to me.
In any case we can, I think, breakout out rides by day of the week, as we have one of each among the data. Motor into the next available column, called it Weekday, and in the next cell down – mine is Y2 – write
=WEEKDAY(A2)
(I’m working with pick-up dates, however warily.) Remember WEEKDAY numbers the day of the week, not the day of the month (that task has been assigned to DAY), with Sunday invested with the 1. Copy down the column and pivot table thusly:
Row Labels: Weekday
Values: Weekday (count)
Weekday (again, this time % of Column Total)
I get
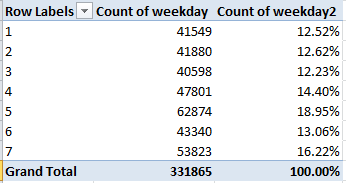
Keep in mind that January 1 – New Year’s Day – was a Thursday, or 5 in the Row Label census above. Note its clear modal predominance, a margin almost surely owing more to New Year’s than to Thursday. Thus in the interests of experimental control, as it were, I downloaded the ride data for January 8, the next available Thursday, one free of confounding holidays. There the ride count came to 47791, far more in keeping with the general shape of ride distribution, but still a touch high. Note then Saturday’s “real” ride edge, a potential concomitant of that day’s small pull-back in public transportation frequency and an uptick in late-night festive plans, if that’s not too stereotypical. Of course we can’t clinch that latter surmise, because the PM ride time-stamps have been overwhelmingly blunted.
And how about passenger count?
Row labels: Passenger_Count
Values: Passenger_Count (Count)
Passenger_Count (here % of Column Total)

No particular surprises with the one-passenger hegemony, though one might be moved to inquire about the five-passenger fraction, far outpacing the three and four-rider fares (the zero readings for seven and nine-passenger pick-ups have everything to do with the two-decimal roundoffs, which need to be extended for presentational purposes). Data integrity, anyone? I don’t know if there’s a problem here, but when a flag waves in your face don’t blink – and that’s in addition to the 97 zero-passenger count.
There’s more in there, but in light of the demurrals sounded above what you’ll find when you enter needs to be considered with some care (e.g., the 500 or so negative fare amounts). Enjoy the journey.
And now it’s holiday time for me. I didn’t say I deserve it, but I’ve pencilled it in just the same. Hope to see you in about two weeks.

Leave a comment