You’ve doubtless spent the past week chewing over the Chicago inspection data, and in the course of your mastication your molars may have crunched on one of those very things that, as per the close of last week’s post, I stated needed to be worked out.
That particular thing is this: The 110,000 or so inspection records before us in fact make known the results of 28,000 or so actual, discrete eateries, because they remember the data for multiple inspections of the same establishment. That hyper-inclusiveness is unusual; the UK restaurant inspections at which we looked some time ago, by contrast, confined their scrutiny to the establishments’ last inspection. And the Chicago insistence on plurality – the recitation of results across the data set’s chronology (beginning with 2010; I wrongly named 2012 as the start year in last week’s post) for the same restaurants – drops a question onto our napkined lap; Given the several inspections per eatery, what exactly do we want to look for? A wholly undifferentiating set of inspection averages – admitting any and every result, into a pivot table, for example- might inflict a debilitating coarseness upon the analysis, mixing apples, oranges, and a sprinkling of asparagus into the recipe. The effect might be tantamount to incorporating a set of baseball players’ batting averages from the same season into a table, but at different points in that year.
But we could perhaps start with a pivot-tabled count of inspection numbers and average risk ratings grooved by year and month. Here there may be nothing wrong with repeated same-restaurant numbers; the month-year axis should be able to snapshot overall restaurant standings as they proceed longitudinally (unless some inspection skews across the months have tilted restaurant samples by Facility Type, for example, a complication that could probably be researched); but you’ll also have to think about the apparent fact that some restaurants appear to have been inspected several times within the same month, conducing toward a species of double-counting that may or may not madden you. In any event, try:
Row Labels: Inspection Date (grouped by Months and Years)
Values: Rating (Average)
Inspection Date (Count; again just about any field could be counted here)
I get (in excerpt):
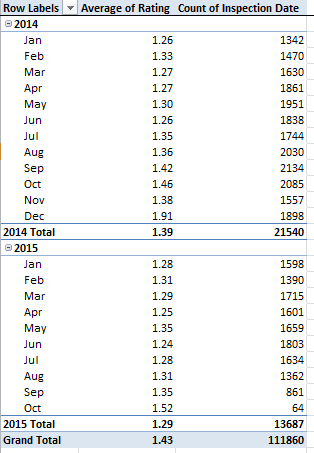
Of course the incomplete 2015 inspection-number aggregate falls well beneath its preceding year, but the 2015 1.29 rating average (remember lower means a restaurant is health-riskier) places it notably behind the earlier figures. There’s a story line, folks: does that 1.29 follow upon less forgiving inspection standards, or some other methodological novelty?
Now we necessarily turn to another data consideration, this one meat-and-potatoes in its banality but make-or-break in its essentiality: any interest in engineering a results breakout by Facility Type – a natural investigatory intent – will have to deal with the data consistency problem – somehow. Just throw Facility Type into the Row Label sector of a new pivot table and view the entries (in excerpt we’re eyeing its upper tier):

You see the problem(s). All those 1023s need equating, including the 1023 dining alone (note the misspelled “Childern’s” for example), and you’ll need to decide what’s meaningfully different about Banquet Dining, Banquet Facility, and Banquet Hall – along with Assissted Living, and all those Bakerys. Lots of work to be done in there, but if you want that a FacilityType breakout, you’ll have to get your hands dirty.
And once, or if, you’ve sorted out the above morass you may want to think about, say, viewing average inspection ratings by Facility Type, of which there are quite a few, even if you’ve actually performed the vetting and winnowing. And that breakout might seek to work with the most recent inspection for each restaurant – only.
Sounds good, but don’t expect a bump-free ride through the data here. For one thing, you’ll need to nail down a unique identifier for each place – and that singular datum appears to be License #, and not DBA Name (think about all those Subways franchisees in there). Then – and I’ll grant that other passes at the problem are probably out there – I’d execute a Custom Sort, first by DBA Name and then by Inspection (the latter Newest to Oldest). Next I’d roll out the Remove Duplicates utility (look here for a review of that most handy feature) select DBA Name only, and let it rip. What I think happens – and according to this discussion it should, because we’ve sorted earlier dates beneath later ones – is that the redundant DBA Names with earlier (that is, those records positioned lower down in the data set) inspection dates get blasted out of the set, leaving us, we hope, with only the last, latest inspection for each restaurant.
If that works then you can pivot table the remaining 28,000 records:
Row Labels: Facility Type
Values: Rating (Average)
Rating (again, Count)
That all sounds good too, but I won’t even bother screen-shooting my results here – because I haven’t carried out the Facility Type cleanup I urged upon you earlier. Also remember that by removing duplicates you’re left with a far trimmer data set, an austerity move that might call for an immediate Save As, the better to save all the original records in the original workbook.
Whew – they don’t pay me enough to do this kind of thing. As a matter of fact, they don’t pay me at all.

Leave a comment