Trust me; there have been other elections contested across the planet of late that do not involve candidates with big hair and/or trademark pants suits. Consider, by way of example, that now-annual attestation of Parisian fiscal democracy, the Budget Participatif, for which we budgeted a couple of thousand words last year in a pair of posts.
The budget referendum, you may recall, asks Parisians to point their collective thumbs up or down at several hundred project proposals for the city, some specific to one of Paris’ arrondissments (districts), the others citywide. What’s not pinpointedly specific is the definition of a Parisian, understood here as a resident of the city – that’s all. My Google translator imparts some additional slack to the eligibility requirements: “All Parisians may vote without age or nationality (Parisians who live in Paris are deemed Parisians).“ We’ll have to call the translation a free one.
Locutions aside, the Paris Open Data site again brings 2016 referendum results to our attention, right here:
https://opendata.paris.fr/explore/dataset/resultats-des-votes-budget-participatif-2016/export/
Just click on the Excel link; then take a look at what you’ve downloaded.
Surprise. If you think back to last year’s resultats spreadsheet – and if your recollection fails, observe this excerpt:

Seven useful fields in there, naming and counting the information any interested party would seek to know: the sums of the budgets earmarked for the project (in euros), project arrondissement (75000 points to a citywide proposal), internet and in-person vote numbers, and their joined totals (though I’m not sure what the decimals bring to the party), the fate of each vote (GAGNANT flags a winning project, NON RETENU a losing one), and project description. Now unwrap this year’s workbook. It can’t be manageably screen-shot; its 72 columns won’t miniaturize intelligibly, so you’ll have to unwrap it yourself and endeavour to survey its mighty expanse.
In a year’s time the Budget Participatif worksheet has mushroomed its field count by an order of magnitude – even as it sets forth what is in effect the same information, with perhaps one exception we hope to acknowledge later. Where in the 2015 rendition but one superordinate field properly subsumes all the voting information about each and every arrondissement (i.e., Localisation, in column D), the current sheet grants three fields to each – one for its internet and in-person votes, the third totalling the former two.
And if nothing else, new navigational privations burden the sheet. If you want to view the voting numbers for the 20th arrondissement, then, you’ll be in for a long scroll. And the arrondissements are only intermittently sorted in the Localisation field, too.
I’ve belaboured the point in the past, but I’ll belabour anew: the data set reformation instituted by the 2016 version discourages the kind of analysis to which one would be inclined to subject the data.
For but one example: if in the 2015 rendition I wanted to pivot table election results via a Slicer featuring arrondissement numbers, I’d try
Row: Projets
Projets Gagnants/Non retenus (I’ve worked with the Tabular Form layout, and eliminated subtotals)
Slicer: Localisation
(You’ll note the unfilled Values area – our exclusive concern here with text enumeration entitles us to the omission. And you’ll probably want to turn Grand Totals off.)
And I’d wind up with something like:

But you won’t be able to replicate the above on the 2016 sheet – because again, each arrondissement has been gifted with a set of fields all its own, and you can’t filter or slice across fields; you slice the items populating a unitary field. And I’m not so sure how a standard filtering of these rows would work, either.
Indeed – given the wholesale reimagining of the data, ask yourself what pivot tables the current Budget sheet could facilitate. There’s also the matter of row 541 and its queue of what appears to be totals of columnar figures, but these don’t add their respective rows 2 through 540 precisely. Those imprecisions aside, I’d allow that the row need be deleted, or at least resettled, from the data set.
And because of the arrondissement-specific nature of much of the Budget voting – in which district residents decide on indigenous projects – a spate of zeros floods the sheet. This excerpt:
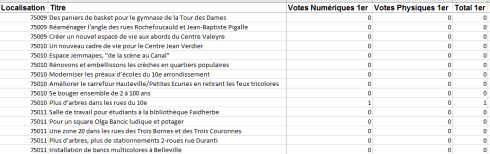
Selects a project vote sampling from the 9 through 11th arrondissements, and the corresponding vote for these in the 1st. What you’re seeing makes near-perfect sense; residents of the 1st aren’t supposed to vote for the projects above (though indeed, the fugitive single vote for the Plus d’arbres dans les rues du 10e begs for scrutiny); and that Paris-wide eligibility stricture has the effect of loosing more than 29,000 overwhelmingly extraneous, zero-bearing cells into the data set, or nearly three-quarters of all the cells.
But The 2016 sheet does widen at least one new vista on the vote numbers, though: it breaks out the vote for citywide projects (the ones denoted 75000) by arrondissement, an insight that the 2015 iteration doesn’t afford. Does that gain, then, offset the inconveniences wrought by the new data organization?
Bonne question; and if Paris Open Data is happy to foot my Eurostar bill I’ll be happy to ask it for you in person.

Leave a comment