If you want to be a legal alien in the United States you’ll need a visa. If you’re technically skilled the visa of choice is the H-1B, described by the Public Enigma open data site as”…a non-immigrant visa that allows U.S. companies and organizations to temporarily employ foreign workers in specialty occupations.”
If you want to learn more about the speciality cadre join Enigma for free, carry out the requisite click-throughs (the H-1B data are advertised on their home page) and you’ll find yourself here:
Opt for the 2017 edition, click the ensuing Open in Data Viewer button, and then click in turn the Export Dataset button centered of the trio of links below (though you can’t get this far unless you join Enigma and sign in):

Then break for tea time while the data mows a swath through your RAM and as last overtakes your screen; and with 528,000 visa application records amassing 154 MB, that’s a lot of Liptons.
Yes, you’ll have to perform the usual column auto-fit necessities, and you may want to think about which fields could be safely sheared from the data set, in the interests of a healthful file downsizing. (You may also want to rename the character-ridden worksheet tab.) It seems to me we could do quite nicely -at least – without employer_phone, employer_phone_ext, agent_attorney_name, agent_attorney_city, agent_attorney_state, and the wholly desolate pw_wage_source_year. These truncations have the effect of scaling my workbook down to a svelte 86 MB. (You may want to retain employer_country, though; several nations other than the United States are listed therein.)
Once having thinned the file we can go to work, starting with a simple resume of number of visa requests by state. My pivot table looks like this:
Rows: Employer_state
Values: total_workers (sum; sort largest to smallest)
total_workers (again, here % of Column Total)
You may also want to filter out the very small number (25) of blank records.
Note, by the way, that total_workers doesn’t always register one worker per visa request; a great many of the applications record multiple applicants.
My pivot table looks like this, in excerpt:
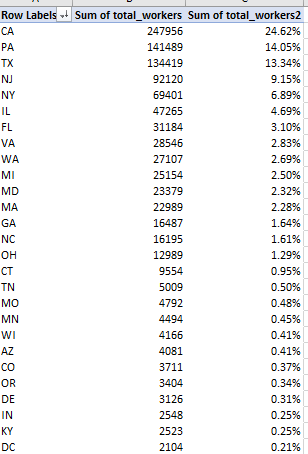
High-population, hi-tech California submits nearly a quarter of all of the H1B applications, with the top three states, including Pennsylvania and Texas, handing in 52% of them all. Grand total of H1Bs: over a million.
(Note that the output comprises 57 rows, because the application data counts the District of Columbia (DC) the nation’s capital, not accorded state status), and US territories: Puerto Rico (PR), the Virgin Islands (VI), Guam (GU), Micronesia (FM), the Northern Mariana Islands (MP), and American Samoa (AS).)
And what proportion of application requests were approved? The pivot table should furnish the answer:
Rows: case_status
Values: case_status (count, % of Column Totals).
total_workers (sum, % of Column Totals)
I get:

We find nearly 89% of the applications win governmental approval, with another 7% or so securing the okay even as the submission was withdrawn, for whatever reason. The certifications in turn accredit an even larger set of actual applicants; including the certified withdrawals, over 96% of the individuals seeking the H1B visa acquired it, at least for the time frame within which we’re working. Thus we see, latter-day controversy and clamor over immigration notwithstanding, that these visa applicants, ones in possession of specialist skill sets, are almost always shown the open door – remembering at the same time, however, that by definition they aren’t long-term immigrants.
We can next quickly recapitulate the average wait time distancing an H1B visa application from its decision date, via a pretty straightforward array formula asking us in effect to simply subtract all submission from decision dates, stored in the case_submitted and decision_date fields respectively. In the interests of key-stroke economy I named the fields sub and dec, and entered, somewhere:
{=AVERAGE(dec-sub}
That pert expression subtracts each submission from its corresponding decision date and averages them all. I get an average wait of 31.21 days per application, though a scan of individual waits discloses very substantial variation.
I then wondered about the comparative handful of application denials. Do they evince notably different wait times, in view of the fact that these entries culminate in rejection? For an answer I named the case_status field stat and entered this array formula, again somewhere:
| {=AVERAGE(IF(stat=”DENIED”,dec-sub))} |
The formula nests an IF statement into the mix, figuring the application wait times for those entries in case_status that read DENIED. In any case, I get a denial average wait of 4.06 days, a far swifter set of judgments. Perhaps those applications triggering denials are so egregiously ill-suited that the decision becomes easy – though that’s merely plausible speculation.
In the meantime, I’m getting excited about filing my own visa request. After all, my specialist skill set is formidable – how many left-handed spreadsheet devotees have so few Twitter followers? I’m stoked.
But I just remembered. I’m ineligible for a visa; I’m a US citizen.

Leave a comment