Call it a footnote, addendum, postscript, or rather call it for what it is – unvarnished forgetfulness – but my longitudinal appraisals of Olympic athlete heights and weights last post walked right pass the most obvious case – basketball.
What other sport, after all, jams its goal ten feet above terra firma, and so casts its net – pun intended, heh heh – for the tall and majestically wing-spanned? Jump on this pivot table, then:
Rows: Year
Columns: Sex
Values: Height (formatted to two decimals)
Weight (format as above)
Slicer: Sport > Basketball
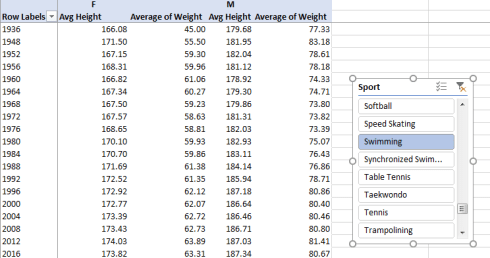
Nothing that women’s basketball took off in 1976 I get, again in excerpt:

You’ll observe that, dating from the 1976 baseline, the heights of both women and men divulge a five-centimeter rise (about two inches), more or less; but scroll back among the men’s data to the 1936 inception point and the end-to-end differential spikes to almost 18 cm, or about 7.5 inches. Male basketballers have also gotten about 41 pounds heavier across the same interval; measured from the 1976-2016 gender-shared interval, the net average increase for men comes to around 25 pounds, and 11 pounds for women. And for what it’s worth, the average women hoopster nowadays is taller than the typical male competitor in 1936.
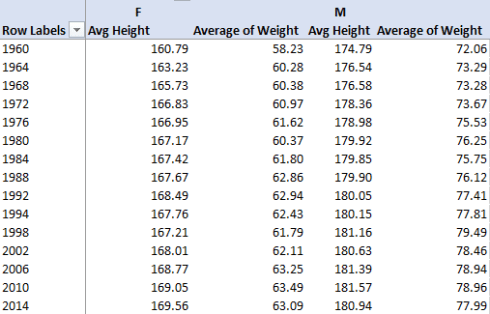
And while I was browsing, it occurred to me that at least one other sport likes its entrants long and tall – volleyball, introduced to both genders in 1964. Slice for volleyball and:
The average 1964-2016 height boost for women and men: a notable, nearly-identical 12-plus centimeters.
Now you’ll recall that Part 1 of this trilogy issued a clarification about the data set; namely the fact that many athletes are recorded multiple times in a given Games, if they competed in a plurality of different events in any year. I allowed then that the reasons for counting the same entrants repeatedly in the various pivot tables I compiled could be defended, and I proceeded from that conceptual springboard.
But that policy could be reframed and executed anew. If in fact unique Olympic appearances of athletes by Games could be shaken out – that is, if we counted but one instance of each athlete per Games – would the age and gender distributions I reported in Part 1 depart materially from the ones I could collate here?
Let’s see. First, we could shear the redundant athlete records from the data set via the stalwart Remove Duplicates routine, selecting the records by their ID and Year fields; that decision should preserve one iteration of an athlete for each Game (if you want to give this revamped data set a good you may want to save the workbook under a new name). Going ahead, that run-through discharged more than 80,000 now-excess records from the set, leaving a mere 187,000 or so behind to submit to a round of pivot tables replicating the batch I minted in Part 1 (in the interests of presentational lucidity I won’t paste the Part 1 tables here; they’re still back in there whence they came, though).
I began with a breakout of average athlete ages by gender and sport:
Rows: Sport
Columns: Sex
Values: Age (average, formatted to two decimals)
I get, this time (in excerpt):

The differences are very small and indeed in most cases simply not there at all, and for a good reason: most athletes tried their hands and feet at one event per Games. Small differences do attend the Diving averages, because some divers essayed multiple events in the sport (remember Sport defines the general category beneath which the various events are gathered). You can’t see the figures above, but even the age averages for swimming – a sport in which entrants often plunge into several pools – are near-equivalent, at 19.48 and 21.38 for the entire data set and 19.53 and 21.51 for the unique compendium.
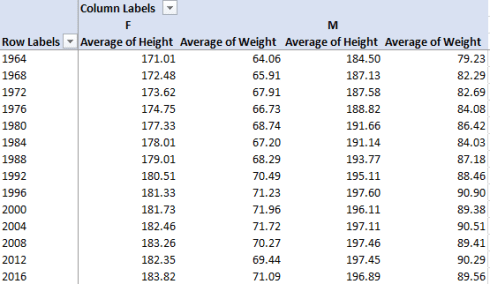
Since the numbers appear to match so thoroughgoingly let’s move to but one more comparison, the alignment of age averages by gender and year of Games. Replace Sport with Year and I get now in excerpt:
You’ll see again that the divergences are largely minute, though we the unique average here for women in the 1932 games – 26.99 – distances itself appreciably from Part 1’s 29.22 (the respective counts for the two tables: 369 women in the full data set, a significantly trimmer 222 in the unique-record rendition).
But the redundant-record entanglement snares us anew if we move to answer perhaps the most straightforward of the questions we could ask of the data: How many medals has each country managed to win, and by which type? (One preparatory briefing before we advance toward our set of totals – you’ll note the outpouring of NAs flooding the Medal column; but here that classic placeholder in lieu of an unavailable datum means, more meaningfully, that the record in question belongs to an athlete who failed to win a medal.)
But the medal question’s defining detail consists of the means by which the country-by-country medal counts are to be totaled. Consider an obvious case: the United States men’s basketball team brought back the gold medal in the 2016 Games – but that victory, for standard reporting purposes, comprises exactly one medal. Yet the Kaggle data set marks the gold attainment for each of the 12 members of the team, thus unleashing a massive, prohibitive overcount of the medal numbers for this and any other sport contested by teams of any size. That sort of capitulation to the data as they stand can’t work, of course, and thus calls for another dial-up of Remove Duplicates (I’m assuming you’re working with the original, full data set), this time selecting for Year, Event (not Sport, each one of which again spans several events), and Medal, because we want to sieve but one of medal dispositions for each event outcome. Implementing the routine rid the data of over 246,000 redundant records this time, per the selection criteria.
Following that massive jettison, we can apply the remaindered records to this pivot table:
Rows: NOC
Columns: Medal
Values: Medal
(Note: NOC, or National Olympic Committee, assigns a three-character abbreviation to each participating nation, the legend to which may be found here. I’ve applied NOC, and not Team, to the table, because the latter parameter also admits, for whatever reason, the names of actual teams that fielded contingents at the Games, e.g. the Bagatelle Polo Club Paris).
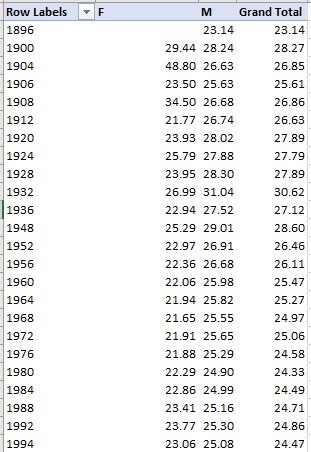
In view of the preemptive steps we carried out above, the table should now properly cross-count medal victories by country, e.g. in a pinched excerpt:

It’s starting to look intelligible, but the article isn’t quite finished just the same. For one thing – and we’ve seen this before – the curious sort priority accorded MAR and MON, or Morocco and Monaco in full, needs to be explained. Those countries are stacked atop the column because Excel reads their codes rather as March and Monday, date data that the pivot table insists on sorting first; and in fact a manual A-Z sort won’t restore them to their proper alphabetical place because they’ll continue to retain what is in effect their mathematical character, and so force themselves again to the head of the list. If you really want Morocco and Monaco to assume their orderly mid-column positions you’ll need to right-click each name and apply the Move option, selecting Down repeatedly until each is bumped into the berth you assign them.
And Move gets to do its thing again for the column entries, because you’ll want Gold – the winners’ precious metal of choice – to station itself at the head of the row, followed by Silver and Bronze. As for NA, I’d filter it out – because Remove Duplicates has preserved but one instance of the non-winners for each and every event and year and that’s misleading of course, because most athletes won’t win any event, and there’s a lot of them.
And if you’re still with me you can sort the values by Grand Totals Largest to Smallest, realizing this hierarchy, in excerpt:
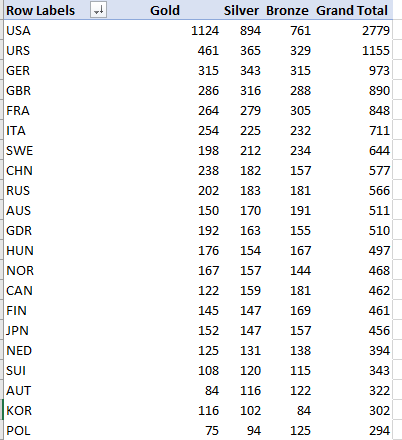
The United States wins gold for most golds and all medals, and by a margin far more extensive than I would have supposed. URS is a legacy reference to the former Soviet Union, but note the simultaneous tally assembled for Russia.
And I bet you didn’t know that Luxembourg has won four gold medals – including two for Mixed Painting, as many as the United States.