Have Olympic athletes gotten taller and heavier? Common sense, the hypothesis builder of first, but not last, resort, submits a yes. After all, competitors in other sports seem to have bulked up and out; so why wouldn’t entrants to the global quadrennial enlarge as well?
The conjecture makes sense, common or otherwise, to me, but fortunately more persuasive corroboration is at hand. The Kaggle Olympic athlete data set features height and weight data, thereby adjudging my sense-making a false start.
Nevertheless, a few important caveats need be pronounced upon the data. First, a notably large portion of the height and weight entries – around 60,000 in both cases, or around 22-23% of all athlete records – are missing, and I haven’t paced my way through the data to learn if those ciphers are systematically distributed (and by the way, about 9,500 age records, or 3.5% report no ages either). Second, one must take some care to think about the like-for-like proviso, in view of the turnover of events appearing in this, but not that, Olympic year. There may be little analytical gain, for example, by according a place to the weight and heights of the combined 3,578 aspirants in the Art Competitions last conducted in 1948. One assumes their vital statistics contributed little to their medal fortunes, though one never knows (and since you asked, their average weight came to 165.64 pounds, with a mean height reaching to about 5’9”); but because the demographics for those pastimes simply aren’t there in the later Games their confounding effects must be considered, and probably discarded.
In addition, because boxing necessarily cordons its contestants by weight classes, its 6,047 contestants should be expected to evince little variation along that parameter across Olympics, and they don’t (they haven’t gotten much taller, either).
With those cautions in mind, investigative prudence might justify a concentrated look at those durable sports expected to win a continual place in the Games. We could then proceed to pivot tables buffered by a Sports Slicer that would more afford a cleaner look at the question, one sport at a time.
If we’re satisfied with that recommendation, any pivot table that would spring therefrom sounds like a rather straightforward proposition, but grouping Olympic years by a chosen interval – say a 12-year tranche that would parse three Olympics at a time imposes a small presentational disquiet.
My initial intent, for example, was to group the years into bins of 12 in the interests of averaging heights and weights for three Olympics at a time (but recall that the eventual rethreading of Winter Games into alternative even-numbered years would step up the number for any 12-year stretch). If, then, we move Year into Rows and frame the 12-year grouping, we’ll see:

Now that bit of consolidation works, but note the disclosure above of some years in which no Games were held (e.g. 1907), and which in fact don’t even appear in the data set. But the pivot table insists on interpolating those years in order to preserve the grouping’s consecutive character, however misleading to the reader. But remember that Row Labels can be edited for display purposes, that is to say you can rewrite the above spans 1896-1904, 1908-1916, etc.
On the other hand, because the data set counts a manageably grand total of 35 modern Olympics, we may be happy to leave the years as we find them in their singular, ungrouped state. If so, we can begin this way:
Rows: Year
Values: Height
Weight (both computing Average and formatted to two decimals)
Columns: Sex
Slicer: Sport
And turn off Grand Totals.
With all those material variables in play – Year, Sex, Height and Weight – the pivot table may tend toward a certain untidiness and hyper-density. Truncating the Average of… labels to something like Avg Height should sharpen its legibility.
Because I’ve delimited my interest to those mainstream sports likely to have been fielded across most or all Olympics, I can aim my first Slicer tick at Gymnastics, mustering these outcomes in excerpt:

Note, my fellow Americans, that height and weights are expressed in centimeters and kilograms, respectively. (To restate the former in inches you’d need to multiply each entry by .39701, one formulaic way or another. Poundage is expressed by multiplying a weight by 2.20462 (I had long thought the increment was exactly 2.2)). As for the #DIV/0! messages besetting the table that allude to sliced fields containing no data, these can be air-brushed out of sight via the PivotTable Tools > Analyze > Options > Options > Layout & Format tab and leaving the relevant field below blank:

Returning to the gymnasts, note the decided lightening of women gymnasts from 1948 through 1980, an average weight reduction, so to speak, from 57 to 41.42 kg, or well over 30 pounds. Indeed, women gymnasts were on the average 5.89 kg, or 13 pounds, lighter in the 1980 Games than in the 1976 competition; but the poundage reverts upward again from 1980.
Explaining the variations requires something more than a top-of-the-head, knee-jerk, or any other such anatomically-driven response. Remember for one thing that many women gymnasts are counted multiple times among the data, and so their weights are submitted to the averages as often. Secondly, a survey of the particular gymnastic events in force for any given Games would be in order as well (the Gymnastic heading spreads over a variety of events), as new or abandoned events could have skewed the totals. In addition, the boycott by 66 nations of the 1980 summer Games may have likewise wrenched the average down.
On the other hand, the weight trajectory for male gymnasts is considerably smoother, tossing but one more complication into the mix.
We could next slice for swimming, another Olympic perennial. I get, in excerpt:
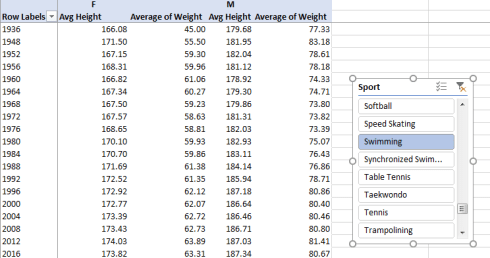
Here we see both men and women getting taller and heavier, with the paired slopes lifting upwards determinedly. That male average weights have burgeoned 16 pounds between 1972 and 2016 and the male-female weight differential has gradually ascended surely means something, though again some deep thinking about conclusions would be in point.
For a look at a winter sport, let’s slice for speed skating, opened to women in 1960:
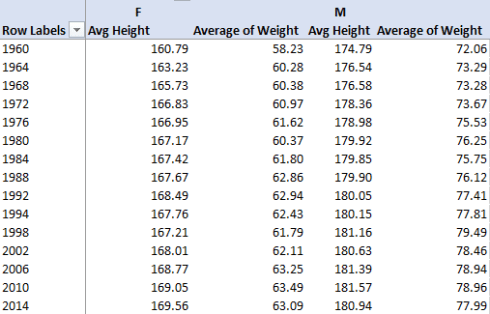
Here the fluctuations are gentler, perhaps remarkably so, along with a small but measurable closing of the gender weight differential. You’ll also note that gymnasts tend to be shorter than both swimmers and speed skaters. But swimmers and skaters need to get to their finish lines sooner.

Leave a comment