Thumb back to my previous post and you’ll reacquaint yourself with my concededly makeshift, but eminently workable, rewrite of Excel’s camera tool job description. To review: the tool reproduces live pictures of cells, contents and formatting included, and as such keeps step with any changes made in the source cell. I suggested in turn that, in view of their picture-graphic status, these little data clones could be dragged across the worksheet into meaningful formations, lining up into what are in effect low-grade data vizzes, e.g., my representation of student grades plotted against the class seating plan:

To be sure, the hows and whens of this kind of application need to be thought through. The camera tool can’t practicably spill large vats of data onto finely mapped turf, e.g., crime events pinned to latitudes and longitudes – the kind of thing that the Tableaus of the digital world are designed to handle. But it can find its place in more homely, user-framed settings with high manipulability, as per the faux classroom above, and can add trenchancy to the viz when a jot of interactivity sautés the mix. For example, additional test administrations introduce a measure of choice to the user (once all the formulaic fixes have been put in place, of course):

Click on a different test, and the camera captures change. (Again, note the conditional formatting of scores equaling or topping 90.)
But in fact Excel’s formatting portfolio cites an alternative graphic data-point-capture option, one that likewise has been around for ages but is typically cold-shouldered from any data concerns – its catalogue of shapes. Draw any shape, select it, then click in the formula bar and enter any cell reference. The shape will return the cell’s numeric or text entry, e.g.:
(Those entries can comprise formula results as well).
Needless to say, these objects can be swung anywhere on the worksheet too, and appear to boast these advantages over the camera tool:
- Far greater shape possibilities (click the Insert tab Shapes button and you’ll see what I mean)
- Fewer demands on pc processing speed, thus hastening the viz construction process. The worksheet simply moves faster when shapes stake the sheet, at least as per my experience.
Thus the test score/seating plan scenario could be redrawn:

(Tip: by selecting a shape and clicking Ctrl-D you can reproduce it rapidly.) Labile and more processor-friendly, shapes would seem to carry the day, but for one pause-giver: absent a VBA-driven remedy (see, for example, http://www.tushar-mehta.com/publish_train/xl_vba_cases/0301-dashboard-conditional_shape_colors.htm), you can’t conditionally format a shape. Now that unticked box may not bother you, but if you want or need to colorize data that meet certain criteria, you’ll need to revert to the clunkier, and determinedly rectangular, camera tool capture – because this device duplicates the contents of cells, conditional formats included (e.g., head back to our initial take on the class test results).
At least that’s what I thought; and guess what – I was wrong. A couple of itinerant clicks brought me to the Crop to Shape feature: Picture Tools > Crop > Crop to Shape in the Size button group. Select a camera tool capture and follow the above sequence through, and you’ll see:

Pick a shape, and the camera tool capture clenches itself into that shape – even as it retains its cell capture properties, including any conditional format.
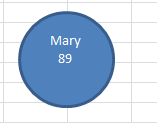
Thus if I click Ed’s original, blue-hued 99 and step through the Crop to Shape routine and go with say, the cube shape option, I’ll bring about:

Let Ed score 89 instead and the cube will return to its native, unconditioned white. Remember too that if you select all the shapes simultaneously (either by holding the Ctrl or Shift key and clicking each shape, or turning to the Picture Tool > Selection Pane in the Arrange button group, a potentially more daunting resort) you can impose the same shape on all the selectees via Crop to Shape.
Crop to Shape – a feature about which I had heretofore pled ignorance – thus packs one more presentational virtue into the data-point capture programme. Point the camera tool at a cell, set it down wherever you wish, and proceed to shape it too. I’ll leave the rest to your imagination. Again, though, prepare to pay a processor-slowing overhead.
P.S. For a sample of all of the above, you can download this viz of the AID data we discussed a few posts ago (drawn from the Guardian):
Just select a category and year from the dropdowns in W8 and X9 (map source: www.freeworldmaps.net, one of several sources of outline maps you may want to use for data plotting).

Leave a comment