Those in search of a handle – albeit a slightly slipperly one, perhaps – on the current representation of women in the journalistic arts can turn to a Guardian-authored spreadsheet on the matter drawing upon data afforded by the Open Data Tracker, an open source service underwritten by the Knight Foundation.
The spreadsheet, available in Excel adaptation here:
GenderTracker_ Global Voices Gender Balance Case Study – Data
breaks down numbers on story authorship by gender, the intents of its respective worksheets abstracted in the Introduction sheet. The data source? The archives of the Global Voices blog, which builds “an international community of bloggers who report on blogs and citizen media from around the world.” (And thanks to Open Gender Tracker principal Irene Ros for clarifying this. Open Gender teamed with the Guardian to gather and structure the data.)
But before we place the data under our sheet-by-sheet consideration, a bit of necessary prolegomenon begs our attention. It should go without saying that, because the blog posts are presumably volunteered, and hence by definition self-selected, the data cannot broach the incipient, larger question: whether women have been, or continue to be, treated with invidious regard across the journalistic marketplace. Our take here is on the spreadsheet qua spreadsheet; hearing the larger socio-political messages would require a different set of ears, and probably a research grant.
Gender Counts by Year – The sheet simply parses authored article aggregates by gender and year. The Total column imposes a set of curious redundancies upon the data, though, citing each year’s aggregate three times – once each for Female, Male and gender Unknown. A pivot table would have communicated the point a good deal more presentably:
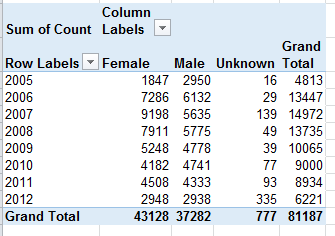
And once in place, the data could be rephrased in percentage terms:
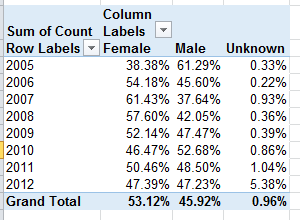
We see the gender proportions charting a wavy course across the eight-year term, with female contributions nevertheless enjoying a clear authorial margin. To be explained, however, is the bump in gender-indeterminate bylines for 2012. And remember that the above tables tabulate article volume, not the totals of actual, discrete women and men who contributed pieces. Calculating that latter metric would entail a round of hoop-jumping that might better be reserved for another post, but those data appear to have been registered in summary form in the Articles_Author Split sheet.
Author Data – Some additional curiosities here, its byline-gender attributions masked behind a 32-character code, which I am taking be randomized. I am privy neither to the mechanics nor the strategy justifying the code, but it seems to me that a simple numeric assignment to each author would have done the same work, unless the report generators feared that a simple, relatively memorable integer would come to be associated with a particular author and hence his/her gender. If that be the case, a lookup table in which each byline code could have been associated with a conventional number, to be assigned to the author identities solely as we see them here in the spreadsheet, would have neatened the data. Thus the sheet before us could have been reconditioned into this kind of tableau:
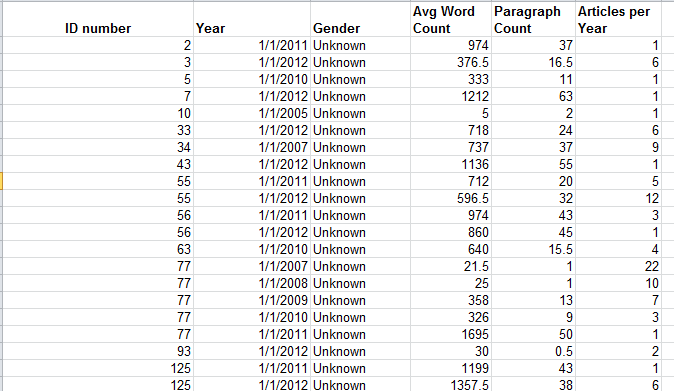
even as Open Gender Tracker would have retained the original IDs.
Moreover, we should ask why the Year field submits month and date specifics (always the first of the month) into the expressions, when all we really need here is the year reference.
I’m also not terribly sure what the Paragraph Count field brings to the exposition.
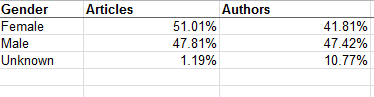
Articles_Author Split –Again, I’m not entirely certain what “high level” (which perhaps could have been hyphenated) means, though I’m assuming that the workbook wants us to know that the numbers summarize overall totals, foreswearing any data drill-down. Be that as it may, the numbers would have profited from a percentage reformat:
Number of Articles Per Author – I’m drinking too much coffee, because I had to think at least twice about this one. What it’s trying to do, simply enough, is break out authors by gender and their output, in decidedly uneven tranches. (I’m prepared to be corrected, but so far as I know this kind of breakout is not pivot table-capable,by the way, because its Group Selection feature insists upon equally-sized groups. The FREQUENCY function, something we haven’t discussed in this blog, will accommodate such lopsided distributions.) Again, note the redundant Total column (see Gender Counts by Year above). It’s hard to take this sheet any farther, in part because we aren’t told how many articles populate each of the tranches but rather only the number of authors, graded here by output and gender.
Number of Articles per Author, Full Posts – That’s the tab’s entire, original, Google-doc-dubbed name, clipped on our sheet by Excel’s 31-character tab-name limit. I’m not sure what’s normalized about the data in that eponymous column, comprising as it does a straight calculation of gender proportion by tranche. Again, the percentage format here would be welcome, and that redundant total column makes a reappearance. The second collation of data embarking from the H column reports the same data but attired in a more reader-friendly layout, one that emulates the pivot table, cross-tabular, conceit. Note by the way the right-aligned 3 in the Group data; that’s because that digit is an actual number, even as the dash-splayed other groups assume Text format. (23-1189 is text; =23-1189 is a bit of subtraction).
Category Summary – Again, the Percentage format would streamline the Percentage data. But note that the reiterated Categories don’t inflict the same sort of superfluity upon the data we witnessed in the other sheets, because the repeated entries here are text, and such are needed to identify the associated percentages. The other, quantitative excesses identified in earlier sheets are redundant because they could have been derived mathematically and made to appear once each.
So there you have it, the data all tidied up in most fetching array. Who says men don’t do housework?

Leave a comment