Here’s what I was looking for:
http://spreadsheets.latimes.com/
Fire away at the target above and you’ll drop yourself onto the spreadsheet page of the Los Angeles Times’ Data Desk, a rough left-coast equivalent of the Guardian’s Data Blog. I’d been getting myself lost en route to the page, vainly shambling across the Desk’s missing links and the smudged latitudes of the Times’ site map, until I decided to take the back door via surreptitious Google ingress.
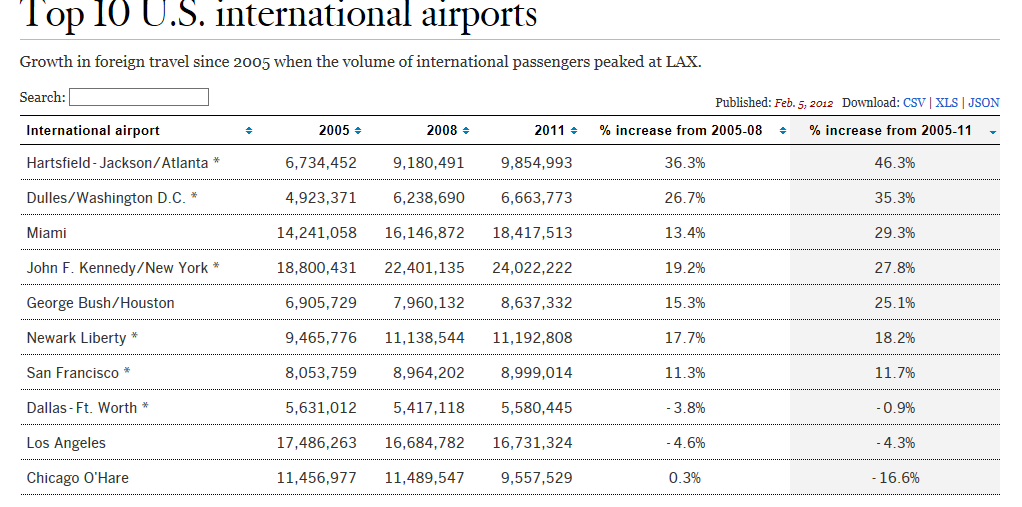
Once you’ve at last arrived, a link-bearing catalogue of the Desk’s spreadsheets unrolls down the page. Click any one and its “spreadsheet” offers itself onscreen in tabular form (that Search field filters the records by search item):
If you want to realize the data in genuine spreadsheet, save-worthy mode, click the upper-right-cornered XLS link or right-click atop the data and select Export to Microsoft Excel, a hoary option which actually works on these sheets.
The sheets are nothing if not variably forthcoming. You’re viewing the airport sheet above in its entirety, and another one, Smartphone Stats, comprises exactly three records – one each for the iPhone 5, iPhone 4s, and the Galaxy S III. Others, however, such as Kern County Pensions – an enumeration of 1900-plus county workers and their retirement settlement/final year salary data, give the investigator a good deal more to work with.
In any case, and recusing myself from any facile searches for cross-cultural truths, I’d allow that the Guardian exhibits the greater amity to the spreadsheet medium than the Data Desk, the former’s data-quality issues notwithstanding. Far more of the Data Blog holdings assume a spreadsheet identity, though I’m not terribly sure why.
But let’s put the anthropology on hold and turn to a Data Desk sheet, Unlimited outside money, brought to you in proper spreadsheet mode here:
The data break out contributions to various Los Angeles electoral contests by what the Times calls “outside groups”, entities not beholden to spending thresholds. The 449 records tell their story in straightforward parameters including a date field, and so grouping the money by say, month of disbursement, might tell a tale worth reading about. There’s just one problem, and we’ve encountered it before: the dates aren’t dates. Right now they’re nothing but text, and they need to be overhauled into numeric fighting shape if you want them to play a group, or any other quantitative role.
I’ve discussed the text-date problem before, both in my September 13 post here and a companions piece of sorts on the datadrivenjournalism.net site; but like Tolstoy’s unhappy families, every date hobbled by its formatting trammels is different, and calls for a slightly different resolution – and this time I had a hunch. The dates, in their three-lettered month abbreviations, look pretty close to authentic, value-laden data – save that intrusive period (full stop if you’re reading this in the UK). Acting on that self-confided tip, I hit on this idea: why not try a Find and Replace, searching for the “.” and replacing it with…nothing?
Give it a go. Select the D column and click Ctrl-H (or Home tab > Find and Select in the Editing button
group > Replace) and enter:
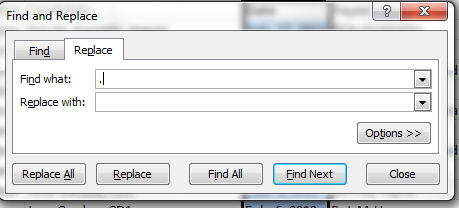
There’s that dot in the Find what field, and nothing more. Click Replace All and…
Voila and check it out:
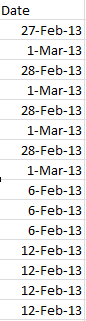
Real dates, real grouping.
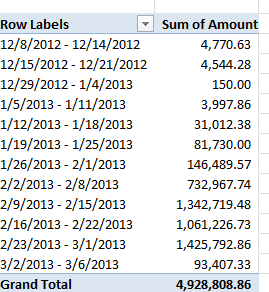
And while we’re at it, an additional word about this grouping business. You may have already wondered about the absence of a Weeks handle in the grouping window:
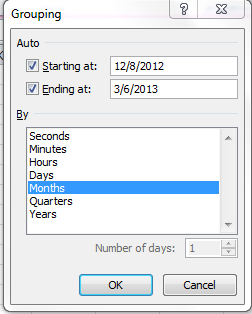
There’s a reason why that option goes missing – because if one elects to group data by say years and their concomitant months an additional weeks breakout is no longer possible, because any given week may pull its days across two months, eg. January 28-February 3, and Excel won’t know where to position that seven-day stretch. Instead, the Days option – which, when selected, excludes the other units from the imminent grouping – can by plied, into seven days or any other span:
And that’s a wrap (bit of LA talk, you understand).

Leave a comment