The recent Guardian map and report on the divergent fates of the Oxford and Cambridge university applications filed by young English and Welsh hopefuls calls for an analytical perspective – or two – before the picture it frames begins to cohere.
The report draws its plotline atop the fabled, notorious North-South divide that runs through so many intra-national comparisons of the UK’s welfare, the right side of the hyphen its privileged half, and London perhaps the more privileged still; and the Guardian makes much of the South’s (or the Southeast’s, to pinch the coordinates) imperial edge in seats claimed by its students at the two institutions. The data to that effect can be viewed here, in a riff on the Guardian’s source spreadsheet:
Cambridge and Oxford applications table
Note that in the finest tradition of digital journalism (assuming it has a tradition) I’ve insinuated a Region parameter into the mix, thus hold out one more data-grouping opportunity for the pivot tablers in your midst.
The Guardian piece calls our attention to the considerable, invidious admissions successes of London and near-London districts. i.e.:
“A single London borough – Barnet – alone had 130 offers of Oxbridge places from 408 applications last year. That equates to 46 applications and 15 offers for every 1,000 16 to 17-year-olds in the borough, according to the latest census figures. Meanwhile, Dudley in the West Midlands – with a similar-sized age cohort – had just 61 applicants and 13 offers, or seven applications and 1.58 offers per thousand.”
And so on, and it’s true; in absolute terms, the Southeast rules (ok , ok – I live in Barnet, but I’m an innocent bystander; I haven’t applied anywhere lately, went to school in the States besides, and don’t have a single A-level to my name). But here’s where you need to envision those perspectives. It’s when you look at the rates of application acceptance by district and region that the numbers begin to speak differently, albeit arguably.
For one thing, a simple descending sort of the Success rate-offers as % of applications field positions Surrey – the largest absolute contributor of incoming Oxbridgers – as merely the 44th most effective gatherer of university places.
In the interests of follow-through, try this pivot table:
Row Labels: Region
Values: Applications (Sum)
Offers (Sum)
Success rate – offers as % of applications (Average, with appropriate formatting). I get
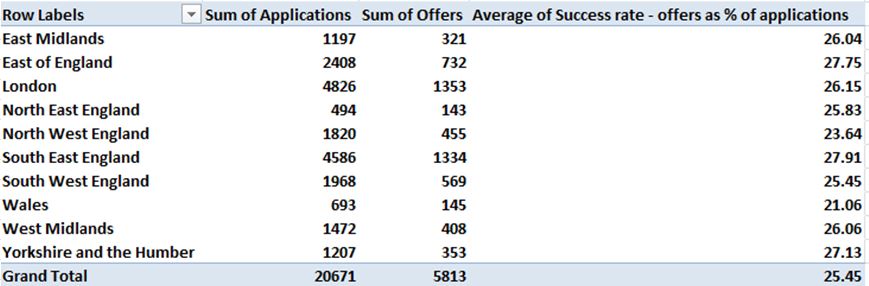
With the exception of Wales and perhaps North West England, whose rates lag perceptibly but haven’t contracted into outlier status, most regions enjoy a rough, remarkable success-rate equivalence, with no conspicuous edge devolving upon London, for example. On the other hand, of course, the absolute numbers read differently. London comprises about 14% of the jointly-totalled population of England and Wales (remember – England is a country in the United Kingdom, not the country itself), but contributes 23.35% of the Oxbridge applications, and 23.3% of the above acceptances, itself a notable near-equivalence. Does London’s advantage attest a recruitment bias, covert or concerted, or de facto – perpetrated by the two elite schools, or rather some complex, region-specific swirl of self-selection decisions bedeviling applicants?
A cynic would ask if Oxbridge is perfectly happy to admit applicants across the UK in like proportions, so long as the absolute numbers of entry-gainers skew toward the “right” kind of student, but that sounds like a conspiratorial reach, I’d allow. On the contrary – absent a wiretap of admission office phones, one could make a case for a determined equilibration of the rates (note: we’ve figured a simple average here, that is, an average of the acceptance averages which likewise characterizes that 25.45% Grand Total. An aggregate average, in which all region acceptances are divided by all region applicants, would necessitate a calculated field – but I’ve done that, and the results aren’t that different).
Note in addition that even the acceptance rates across London’s districts range hugely, from Camden’s 39.8% (76 out of 191 applications) to Havering’s 14% (8 out of 57). I would also call attention to the Guardian’s avowal that
“Three London local authorities – Richmond upon Thames, Kensington and Chelsea, and the City of London – sent more than 25 students to Oxbridge per 1,000 16 to 17-year-olds in 2012, compared with an average of just over 2.5 students per 1,000 for England and Wales as a whole.”
But after tossing out the above three districts, I still get a number closer to 3.6.
(Moreover, the Guardian finds that “Several local authorities sent less than one student per 1,000 young people, with Anglesey, Flintshire and Middlesbrough having the lowest acceptance rates.” My sort puts Middlesbrough at number 158 out of the 171 districts.)
In any case, we could also go on to correlate Applications per 1,000 16-17 year olds with Success rate, in the interests of learning if high-application districts enjoy an admissions edge:
=CORREL(F2:F172,H2:H172)
Result: .199
That association, according to the Statwing web site, is statistically significant but clearly not overwhelming, and leaves a great deal of the variance to be explained. Thus there does appear to be some admissions benefit redounding to application-intensive districts, even after controlling for population size – some, at least.
While we’re at it there’s also another puzzle you may want to run through your local admissions counselor. Head the I column Student Acceptances, enter in I2:
=E2/D2
and copy down the column, formatting accordingly. This modest fraction calculates the districts’ percentage of successful Oxbridge applicants who actually accepted their school’s offer, and the numbers range surprisingly widely. 38 of the 172 districts sport a candidate acceptance rate of 100%, but why 8 of the 22 designees from Manchester – 36.4% – decided against attending an Oxbridge institution remains to be explained, along with Durham’s 10 recalcitrants out of 34 (29.41%).
So where do the numbers leave us? The answer depends on your perspective. (See also the piece by Oxford admissions director Mike Nicholson.) There are those big Southeast Oxbridge admission numbers, countered by the comparable rates of acceptance across the UK. And with competing takes on the matter comes the ancient conundrum of point-of-intercession: is the grand vision of educational parity properly realized very early on in the timeline, in the form of equalized and or compensatory learning opportunities, or at the point-of-sale, so to speak – that time of year when universities alternately lift and shutter their gates to the mass of aspirants huddled on the other side. And given the cachet attaching to a ticket Oxford and Cambridge, the gatekeeping is fateful indeed.
On the other hand, might not a healthful iconoclasm be served by wondering if you have to go to Oxbridge, or even have to want to go there? After all, I didn’t, and don’t – and I live in Barnet.

Leave a comment