If there’s one thing a spreadsheet nerd hankers for and uploads into his daydreams it’s a big fat data set, with scads of records and juicy fields just ripe for pivot-tabling and pattern-spotting and…
…Ok – so have your worst suspicions about me been confirmed? Your right to your opinion is Constitutionally assured, but I’m pressing on with commendable good cheer. Slings and arrows aside, you can cram your RAM with this monster of a file put into place by the UK Food Standards Agency and warehoused by the Guardian at:
Too big for WordPress, the workbook, crated in a Google Doc box but available to Excel users via a CSV download, is yours by clicking the above page’s Get the data link.
And once the file – the cryptically named ABC-FSA-csv-2 – has overrun 50,000 or so sectors or two on your hard drive, you’ll be treated to the 348,346 – count ’em, 348,346 – ratings of what might, as the Guardian’s prelude to the data suggests, amounts to every food-concerned concern in the country (save Scotland, which as usual does its own inspection thing), with the exceptions of “childminders [baby sitters], newsagents, chemist shops or visitor centres selling tins of biscuits [cookies to some of us]”. (Note that this file may or may not anthologize all those local authority food establishment ratings on which I reported in the March 7 post. The establishment counts here don’t necessarily line up with the numbers carried by those individual reports, for what it’s worth. Note in addition that the CSV download captures but one of the several sheets the original document comprises, but it’s the sheet we want.)
A file this studpendous could stand some economizing, namely, a skimming off of those fields not likely to figure in your analyses. I’d delete the Source Url, Address Line1, and Local Authority websites parameters; web links will almost surely bring nothing of substance to the table, pun intended, and a vast brief of establishment addresses portend little more than a monumental collection of idiosyncrasies – particularly when the data offer up zip codes to be gathered and grouped far more profitably. I’ve retained both Local Authority Code and Local Authority Name, however, though that error on the side of inclusiveness could be contested, I suppose.)
Curtailments completed we could begin to uncork a series of pivot tables, e.g.:
Row Labels: Business Type
Values: Rating Value (Average, formatted here to two decimals) (Note: establishments are weighed on a 1-to-5 scale; larger numbers signal higher ratings.)
Rating Value again: Count
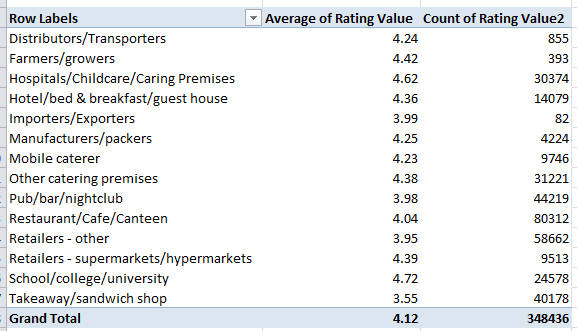
Note the disconcertingly low average for takeaway/sandwich shop (will you ever look at that ham and cheese the same way again?), bookended with the hearteningly salubrious 4.62 accorded Hospital/Childcare/Caring Premises, and the School/college/university’s head-of-the-class 4.72.
If, however, you right-click the Average field and step into PivotTable Tools Options > Summarize Values By > More Options > StdDevP , you’ll see
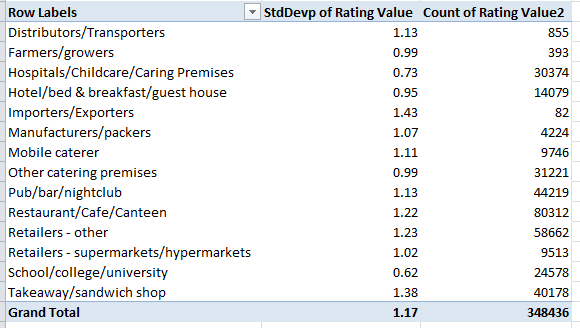
The relatively steep standard deviation for takeaways points to a decided multifariousness among their scores, so perhaps there’s hope for your joint of choice (remember that you can always apply the redoubtable find and replace to hunt down your favorite UK haunt; for a terse distinction between StdDevP and StdDev look here.)
And those scores could be artifactual besides; that is, some intervening, backgrounded, strings-pulling variable could really be accounting for the numbers, e.g. regional or time-of-inspection bias (and some evidence for the latter is recounted in my March 7 post). The follow-on pivot break-out possibilities are plenteous, and here’s but one, a sweep of the data that asks after the UK’s storied north-south economic/cultural divide:
Row Labels: Latitude (grouped by say, .5. You’ll also want to filter the (blank) output here.
Values: Rating Value (Average, formatted to two decimals)
Rating Value again (Count)
Report Filter: Takeaway/sandwich shop:
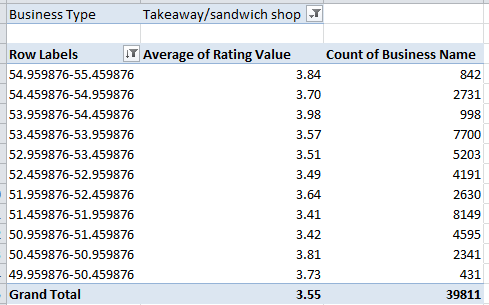
(I’ve sorted the grouped latitudes from highest to lowest, or, given the text-formatted character of the grouped latitudes, Z to A, to reflect the UK’s largely north-to-south gestalt. Note too that over 20,000 records have absconded with their latitudes and longitudes, but even that that formidable blank spot accounts for fewer than 6% of all records). Some areal variation does obtain above, and we can note that London features in the 51.459876-51.959876 swath, the lowest-evaluated geographical band. The correlation between average rating and numbers of businesses counted per grouping: -.787, a result the Statwing web site pronounces Clearly Significant. Is there something about the urban tableau that depresses quality of service?
By way of a cross-check, if we filter for the highest-rated, School/college/university category, we see:
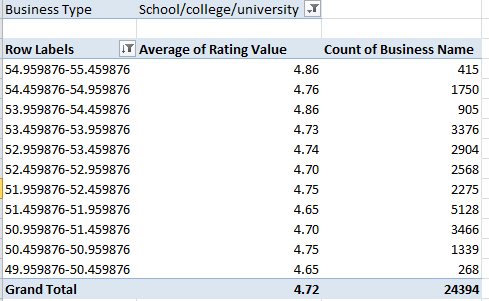
Again the London-centric tranche bottoms out, vying with the southernmost 49.95 rung for lowest rating average. The Rating/number of establishment correlation here comes to -.53, an association Statwing finds Not quite significant; nevertheless, the site considers sample size (that is the eleven latitude cases), without reckoning with the size of each rather considerable per-case business count.
In any case, more possibilities beckon. Hope to plumb some more next time.

Leave a comment