If the data don’t make sense, ask yourself if you’ve had too much coffee – or not enough. Then look again, and ask yourself this time if it’s the beholder, or the beheld.
Because sometimes it isn’t the caffeine. Case in point, I think: my post a fortnight or so ago on UK Parliamentary data and the curious findings attaching thereunto. I reported then, for example, on the intermittently text/numeric statuses of the dates notched in the expenses parliament 2013-2014 workbook, and the most curious piling of expense requests in both the fourth month and the fourth day of months, e.g.,

I concluded my post with suitable notes of bewilderment about these calendrical conundrums, and asked for some time to think about these, which you kindly granted.
And in the course of my review it occurred to me that a second look of the data might be in point, the better to persuade myself that my puzzlement was neither hallucinatory nor caffeinated, nor flat-out mistaken.. I thus downloaded the expenses parliament workbook (now somehow called DataDownload_2013.csv) anew from the selfsame www.parliamentary-standards.org.uk site
and conducted the selfsame
=COUNT(B2:B10582)
operation at the base of the Date field in column B I had performed on the column two weeks ago (and yes, the perspicacious among you will recall that the range stopped at B10581 then). That earlier COUNT aggregated to 5132; but the second take above yielded 10581, a proof that the dates – all of the dates – have now assumed their rightful numeric standing.
Something clearly had changed in the intervening two weeks, disquieting the quality controllers at Parliamentary Standards and urging a rethink of the data upon them, with an ensuing rectification. I don’t presume to know what happened, and won’t dare to assume my previous post had anything to with it.
But musings aside, if you pry open a new column to the immediate right of Dates, call it Day and enter
=DAY(B2)
in what is now C2 and copy it down the column (you can turn off the decimals if you wish and you may have to reformat both this and the Month field into numeric, as opposed to date, status), we can redirect the data to a rudimentary but telling pivot table:
Row Labels: Day
Values: Day (Count)
I get (in part):
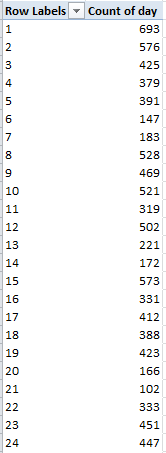
That’s starting to look more like it; the 4ths portion of the whole seems none too egregious. Revise the Values (Count) to Show Values As > % of Column Total and:
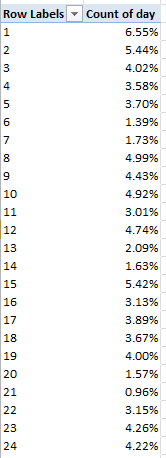
the request-by-day-of-month distribution begins to normalize, though even now no 31st day of any month is represented.
That all looks better; but now admit another new column between Day and Claim No., name it Month and enter in D2:
=MONTH(B2)
and copy all the way down. Start scrolling until you begin to get the idea. There’s nothing but 4s and 5s in there, a set of frequencies too improbable to let stand without a jot of scrutiny.
Or so I thought, until I was enlightened by an unnervingly obvious truth. Your vexed correspondent pointed an email to Parliamentary Standards, whose representative Frank Oppong got right back to me with a decisive clarification. He pointed out that the 2013-14 data as we have them delineate expensing only through May of this year (with the fiscal year kicking off in April), adding that the June and July installments should be put into place next month. (Nevertheless, my questions about the original sheet’s date character appear to remain in point.)
Indeed – if you download the 2012-2013 expense data in their 40MB plenitude, you’ll be heartened to find all the months and days (including all those 31sts) accounted for, and in perfect numeric shape.
But before I dismiss the class, and given the understanding that the 2013-14 sheet presently encases but two months of data, try this pivot table nonetheless:
Row Labels: MP’s Name
Values: MP’s Name (Count)
Amount Claimed (Sum)
Sort the results first by Count of MP’s Name and none other than Peter Bone, a Conservative from Wellingborough, a town pitched 70 miles to the north of London, ascends to the top with 94 expense requests, mostly for vehicle outlays (the MP roster of names, by the way, includes many notables, among these the actress-cum-politician Glenda Jackson and of course David Cameron, who lodged only five requests. Then again, he probably doesn’t have to issue expense requests. His coalition partner Nick Clegg filed ten.) On the other hand, 18 MPs registered exactly one request.
Then sort that table by Amount Claimed and Mr. Bone slinks back to number 149, giving way to Jim Dowd, a Labourite from London whose constituents will be pleased, or at least interested, to find their man soaring to the first position, with £19,294.43 in requisitions for the first two months of fiscal 2013-14.
In sum: the 2013-14 data are as they stand are qualitatively serviceable, but simply have yet to ingather the expense filings accumulated in the recent past (the post-May interim). I should have known. When the elephant is in the room, after all, be sure at least not to let it step on your foot. So let me tack on a Part 3, in the interests of seeing how 187,000 full-year 2012-13 expense requests break out and justify themselves to Mr. and Ms. Taxpayer.
—
And apropos all the talk here about mistakes on either side of the screen, the European Spreadsheet Risks Interest Group (EuSpRIG) spends a good deal of its time on the matter of spreadsheet errors (often ones committed somewhere at the high end), and conducts an annual conference highlighting its work. You may want to check it out.

Leave a comment