Submit a report for £23,000,000 worth of expenses for that business trip and it’s safe to say your boss’ll want you to account for each and every pence of it. For Britons – the putative bosses of their members of Parliament – that accounting is putatively here, at
http://parliamentary-standards.org.uk/DataDownloads.aspx (click the 2012-13 link; again, at 40 MB the file would crumble WordPress’ cookies were I to thrust it upon my blog).
(Note before we size up the data that a far larger sheet, at http://parliamentary-standards.org.uk/ (click the tiny here link), historicizes £98,000,000 worth of outlays. That number also drops salaries into the equation, while our sheet considers expense requests only, but dates each request.)
It should also be added by way of extended preamble that these numbers may have found their way to parliamentary-standards as a species of after-the-fact restitution for the 2009 expense scandal that agitated Parliament (and the voters) and which was, as they say, in all the papers. (For a defense of current expensing practices see this apologia.)
The file is rather ready-to-go, I must say, though you could slice the Year, field in column A off the grid, as it contains nothing but the redundant 12/13 entry. (If however, you were to copy-and-paste the 2011-12 expense data available from the same web venue onto our sheet here – not a bad idea – you’d want to retain the field, in order to disambiguate the two years’ data).
Now that you’ve jammed 187,000 records into your PC’s medulla we can pivot table away, beginning with the most obvious datum: the expense amounts claimed by each MP:
Row Labels: MP’s Name
Values: Amount Claimed (Sum)
Format as you wish. You could then move to sort these, although I’d gather that Alistair Carmichael might vote against that rearrangement. Mr. Carmichael, a Liberal Democrat MP from Orkney and Shetland in Scotland, expensed his way to the first position, requesting – and receiving – £82,949.70. By no means does that sum suggest any manner of malfeasance, however, and indeed, Mr. Carmichael’s peregrinations to and from his home base at the tip of Scotland – about as far away from Westminster as an MP can get – might have served to have engorge his travel costs. (Jim Dowd, the current expense league leader for the first two months of fiscal 2012-13, is hunched down at number 524 for 2012-13.)
And because the factotums in the Cameron-Clegg administration likewise play the MP role – an elision of powers you won’t find in the States – their expense requests, including those of Messrs. Cameron and Clegg themselves, are out there for all to see. Mr. Cameron entreated an austere £6,923.50 during the 2012-13 year, but Mr. Clegg’s £37,672.52 actually brushed past the MP average of £36,043. Labour’s opposition leader Ed Milliband asked for a prudent £26,320.07, even as erstwhile Chancellor of the Exchequer Alexander Darling, about whom expense questions had been raised, filed for £47,381.48, good for 155th place out of the 654 MPs. On the other hand, there’s Michael Fallon (himself implicated in the above expenses controversy), who for 2012-13, at least, checked in with exactly £38.74 worth of requests, these for two stationery purchases. One overarching investigative leitmotif, then, might simply concern itself with the immense variation in expense sums, quite apart from any question of impropriety.
You could then undertake to compare aggregate expense requests by MP to their average request size, by recalling Amount Claim to the Values area a second time and Summarizing now by Average. Assuming your pivot table data kick off at row 4, you could then correlate the two Amount columns thusly:
=CORREL(B4:B657,C4657)
The result: -10003, or by standard statistical lights, no correlation.
Now tighten the thread, by swinging Category into the Report Filter field and ticking Travel. In part, I get:
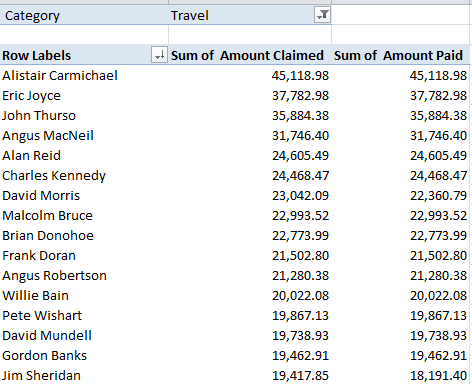
Again, Mr. Carmichael heads the class, commending a larger research charge, then: to correlate MP distances from London with their travel claims. Throw Journey Type into Column Labels in the above table, and the breakout identifies over £17,000 for Between London & Constituency travel, for Carmichael, along with over £7,000 for Within Constituency Travel and another £19,000-plus earmarked for what’s termed Non-London MP-to/from London travel, explained again to me by Frank Oppong to denote the aerial comings and goings of other-than-London-resident MPs to the capitol.
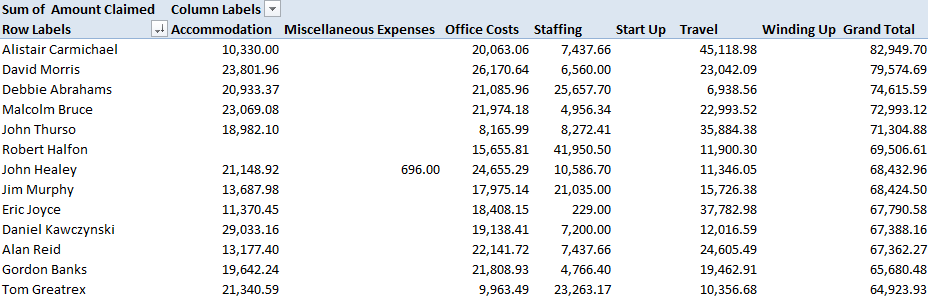
If you then replant Category into Column Labels you get something like this:
Now if you want a dash of seasonality, try for starters:
Row Labels: Date (grouped by month)
Values: Amount Claimed
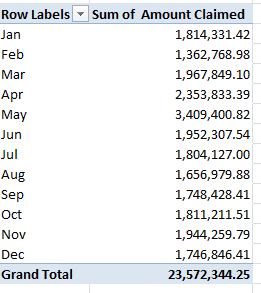
One might thus want to give some pause to the May claims, which may – may – attest early-fiscal-year jumpstarting. Indeed – if you regroup Date by Quarter alone:
![]()
The May (and April) inputs bulges Quarter 2 unmistakably.
As does my stomach. I had a big lunch today – and it’s reimbursable. But don’t worry, watchdogs – it was all strictly private sector.

Leave a comment