As we have begun to see, the broad, deep data from wunderground.com can be whip up both intra and inter-city takes on their numbers. We could, for example, download weather information from multiple locales, mash them into a unitary spreadsheet, and go on to write a comparative, day-by-day history of temperatures and other parameters.
For example, and as per last week’s go-round, I filched the 2012 data for New York, Los Angeles, Chicago, and Dallas, and heaped them into one consolidated sheet, while remembering to pack an additional column named City stamping the respective city names alongside each record. It’s all there for you, with a map about which more needs to be said, right here:
I then shook the mix into a pivot table:
Row Labels: EST (really, the date field)
Column Labels: City
Values: Mean TemperatureC (C for Centigrade)
All of which begins to look something like this:

(Note: there appear to be no New York temperature data for January 29 and 30).
All rather workmanlike and unspectacular, but we can nevertheless point the table in a new direction – aiming it toward a makeshift mapping of the temperatures, spiced with a pinch of interactivity seasoned by a bracing condiment called the spin box.
The resizable spin box:
sits on a branch of the family tree sprouting in the Controls button group, itself planted in the Developer tab – a band of buttons you may or may not presently be bowed neatly on your ribbon. If Developer is in fact among the missing, and it very well might, you can give it its screen debut by clicking File tab > Options > Customize Ribbon and ticking the Developer box and OK:

Once that work is done you can click Insert > Control button group > Spin Button (Form Control), and size the object as you wish.
But aesthetics aside, what does the spin button do? Here’s what: clicking the button rings up a value in a specified cell (called the cell link); each subsequent click boosts or depresses that value (depending on the directional arrow clicked) by a user-defined increment/decrement).
If that’s sounding irritatingly abstract, bear with me and picture this simple example. Imagine a roster of test scores, each test-taker referenced by an ID number:

Clicking a spin button repeatedly will install a number from 1 to 4 in a chosen cell (the cell link), any value of which can be funneled into a lookup formula, for example, that can return a student’s name and/or test score (e.g., the 2 could be looked up to yield either Ted or 81, depending on how the formula is written). The larger definitional point is that successive clicks of the button spin-cycle through a span of sequenced numbers, each one of which can be put to some formulaic or other use somewhere else on the spreadsheet. Our intention here: to have our button spin through all 366 days of 2012, enabling us to flash each day’s city-specific mean temperature in each of four designated cells, one per city. And once that manner of data capture is realized, we want to properly locate and pin each of the city temps on that map via a “camera shot” of the cells (see the December 6 and 13 posts).
So what do we do first? Let’s introduce, and review the mechanics, of the spin button. Click somewhere in the Map sheet and as per the preliminaries above click Developer tab > Insert in the Controls button group > Spin Button (Form Control). Drag the slender black indicator to a desired button size. Next, right-click the button and select Format Control. You’ll see
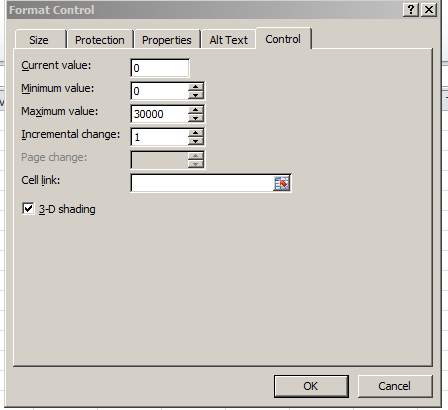
Five fields beg our attention (note that Page Change, an option peculiar to the spin button’s first cousin the scroll bar, is deactivated here). Current value identifies a user-elected number designated to appear by default in the cell link, that is, the cell in which the cycled-through values will register; and so while we’re at it, then, I’ll enter (or click on) O1 in the Cell link field. Again, what we want to eventually see in there is a serial, clicked-through numeric representation of the dates January 1, 2012 through December 31, 2012, each one of which is to be plowed into a VLOOKUP in order to deliver that day’s temperature for each of the four cities – and here’s where it gets interesting. I’ve said it before, and I’m saying it again – dates are numbers, and as the numeric value of January 1, 2012 is 40909, we might as well start the spin sequence right there, and so think about entering 40909 in the Current Value field. But there’s a problem – as intimated in the above shot, the spin button will not entertain values beyond 30000. In other words, you can’t enter 40909 in Current Value – it simply won’t compute.
So I’m going to enter 909 in the Current Value field instead (and again, that value will seat itself into cell O1, the Cell Link) – and why? Because 909 is precisely 40000 less than 40909; and because it is, I’m going to enter
=O1+40000
in O2. That cell of course yields 40909, the numeric twin of January 1, 2012 (intelligibility might be aided by imposing a Date format on O2); and it’s O2 that’s going to supply us with usable date values, the values with which we really want to work – trust me.
But we’re still in the spin button dialog box. For Minimum value again enter 909, and for Maximum value try 1274 – or 909+365, which, when merged with 40000, gives us nothing but December 31, 2012, the final date in our chronology. And leave Incremental change at 1.
And what this all means is this, once you click OK: Each click of the spin button up arrow will plug an increment of 1 into the default 909 in cell O1. O2 will in turn plump each and every increment up by 40000, thus realizing a date value between January 1, 2012 and the end of that year in that cell. Start clicking and you should see what I mean.
Got that? But don’t worry – it’s all downhill from here. And we haven’t gotten to that map yet.
————————————————–
An addendum to last week’s post, in which I noted that the precipitation data for Manchester seemed to have been stuck on zero: A contact from wunderground.com, a gentleman named William, offered that the reporting weather station whence the numbers came “might not be recording precipitation events”, going on to say that entering Manchester at wunderground.com’s home page and clicking Select Station in the following page might blip an alternative local station onto the radar in which precipitation was measured. There was such a station, in nearby Urmston, which marked precipitation for all of 2012 but for but the last two weeks of 2011. Total output, so to speak, for 2012: 158.13 centimeters.

Leave a comment