Having homespun the spin button that’ll pump sequenced values to cell O1, we now need to consider that map – really a picture, and as such nothing like the organically-bred images we detailed in our October 25, November 1 (both 2012) and July 11, 2013 posts. We want in some way to plot the daily temperature readings for calendar 2012 for New York, Chicago, Dallas, and Los Angeles on the map, each according with every click of the spin button that moves us through that 366-day span. Our final installment in the wunderground trilogy, then, endeavors to follow through.
The first thing we need to do then, is stake four VLOOKUP formulas on the Map sheet (I’ve recruited cells O11 through O14 toward that end, simply in the interests of choosing somewhere; it goes without saying you can stake your cellular territories wherever you wish). Each formula should return that day’s mean temperature, per the city it looks up. In this connection I’ve range-named that pivot table we nailed together (see the previous posts) Temps (by clicking PivotTable Tools > Option tab > Select > Select Entire PivotTable in the Actions button group you can indeed select the entire table for naming) and I’ve dubbed O1 Date (remember that it’s perfectly legal and patriotic to assign a range name to one cell). Thus in O11 I can write
=VLOOKUP(Date,Temps,2)
thereby looking up the temperature for Chicago for whatever date presently populates Date/O1 (it’s the Chicago data that happens to line column 2 in the pivot-table that’s serving as our lookup table). Copy that expression down three more rows and edit the primordial 2 to read 3, 4, and 5, respectively in order to capture the temp data for the four cities. And in the service of clarity enter Chicago, Dallas, Los Angeles, and New York in N11:N14. Then click the spin button up arrow and observe the daily movement in temperature flitting across the cities, exactly what we want. (Important note: if you wish, you can always supersede the current entry in O1 – our Cell Link – by simply typing a value into that cell; but that override won’t annul the operation of the spin button, whose normal operation can be kick-started anew at any time by simply clicking the button again.)
If that’s all working we can now tug the city data to their respective positions on the map, by picturing the cells with the camera tool, which I first pulled out of the box and screwed into my Quick Access Toolbar in my December 6, 2012 post.:

For the sake of the example, let’s snap composite shots of the city temps and their trailing names. Select N11:O11, click the camera tool, and sail that slender black cursor over where you believe Chicago to be on the map and click:
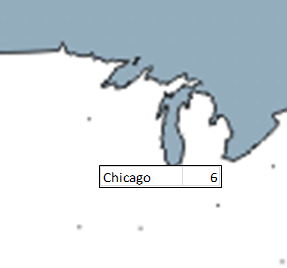
That’s Lake Michigan pointing down at Chicago.
Now it seems to me that Chicago in the photo (look – if we’re using the camera tool, let’s keep the metaphor going) is distanced unappealingly from the 6, and so the imperatives of space management call for a right alignment of the city names in N11:N14 and a mirrored left orientation to the temperatures in O11:14. You could also narrow the O column to further tighten the temperature half of the shot, remembering that the camera tool replicates the appearance of the captured cells in all their regards; trim a column width, for example, and the column remains trimmed in the camera output. (And that the contents of the Cell link in O1 and the formula in O2 may suffer a loss of visibility as a result isn’t calamitous. We’re not principally interested in displaying them in their host cells.) Then point your camera at N12:O12, N13:O13, and N14:O14 and snap away.
Next grab the nearest atlas (it probably has a URL these days), match the city locations to our map, and drag each pic to its terrestrial niche, e.g.
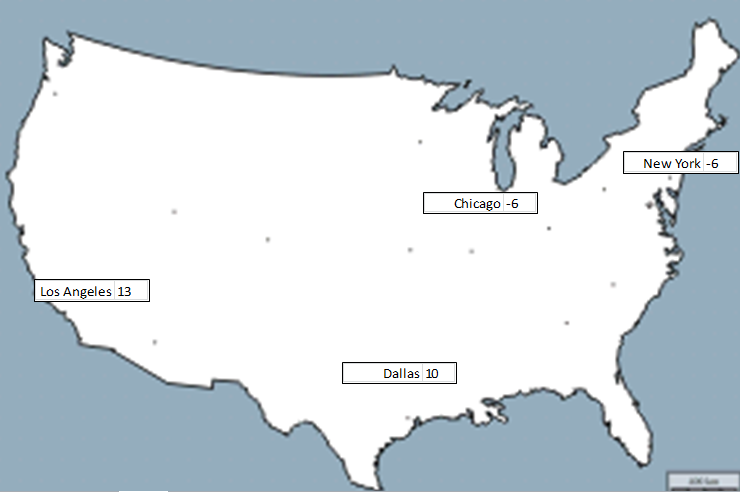
And now let’s wend our way back to something resembling square one. Our greater intent again is to click through 2012, so to speak, with the spin button, and so nest each day’s temperature in its camera shot – and to orient ourselves in time you could, for example, insert a shape on the map or its environs, select it and then enter =O2, format O2 as a Long Date and center it in the shape (making sure the shape has been selected), thus captioning the map:

And if you want you can conditionally format the temperature values in O11:O14, too. They’ll show up in the camera shots. And don’t get scared by those 13 degrees in LA – remember, that’s centigrade.
—————–
Another postrscript, keeping with the above sentence. If you want to translate Centigrade readings into all-American Farenheit, try the little-used but worthy CONVERT function, which mediates all sorts of competing measures of the same sort of phenomenon, e.g. temperature. Check it out – it’s rather easy.

Leave a comment