Sometimes one catches a spreadsheet in mid-construction; that is, the sheet exudes traces of a preparatory, pre-publication primping that has already driven the data some way from their native, unrefined state, before they submit themselves to the reader.
And so it appears to be with the Toronto’s open data site’s resume of 311 calls placed in 2012, that three-digit sequence serving as the number of choice in many cities for their denizens’ non-emergency requests and notifications. For the Toronto spreadsheet, click here:
It’s clear that the sheet has undergone a set of pre-publication tweaks, born both of practical need and some grander data-organizational strategy. For one thing, the calls are merely totalled by day, even though Toronto surely owns the details to each and every one of the calls. On the other hand, an Excel sheet’s 1,048,576 rows simply aren’t fit for the purpose of engaging with the 1,390,412 entreaties put to 311 in 2012, and in any event the data were originally tacked onto in a far-smaller-capacity Google doc sheet. And it was obviously decided in turn that an alternative data vehicle, e. g., a dedicated database, would rather be misapplied here (note: there are other, larger, 311 worksheets on the Toronto site, but these nevertheless report only a fraction of all calls; see, for example, this page).
Note too the sheet’s Day of Week and Weekday fields, both worthy parameters, to be sure. The minimalist in me would have renounced these fields, with the understanding that these data could have been user derived anyway (the former via the WEEKDAY function, for example); but that’s a churlish quibble because Toronto decided to do the work for us, and the fields serve us well. But either way, the data do indeed seem to have been subjected to a prior think-through.
Now before one moves to actually do something with the data – and there are in fact interesting things to be done – we need to perform some supplementary tweaks of our own, starting with the standard column autofit. And because column A contains exactly one data-freighted cell – A1 and its misshapen text-wrapped title – and because as a result that column will feature by default in any pivot table – I’d simply delete the column. And if you sort the Date field from Oldest to Newest you’ll discover that the last six records pull us through the first six days of 2013; and because they do I’d shoot a row between 368 and 369, thus dismissing the 2013s from the dataset.
Then you can start to do what you do best. For a first consideration, try simply breaking out all calls by the Weekday/Weekend binary:
Row Labels: Weekday/Weekend
Values: Calls Offered (Sum)
Calls Offered (again, this time by Show Values as % of Column Total):
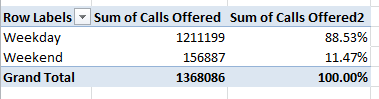
(Note that the dataset bears no record for January 1, 2012; and 2012 was a 366-day year. And note in addition the 1,368,086 call total has shed a few smidgens from the 1,390,412 figure adduced earlier; that’s because we’ve brushed away the 2013 days.)
I don’t know about you, but I’d call that interesting. Left to “chance”, weekend calls would be expected to comprise 2/7ths, or about 28.6% of all 311 calls, but the actual weekend slice grabs a far slimmer apportionment. Perhaps fewer operators are standing by on those two days, or perhaps the good citizens of Toronto have decided en masse against troubling their city with their less-then-emergency inquiries away from normal business hours, though 311 maintains a 24/7 ubiquity. Consider this question your extra-credit homework assignment.
Now exchange Day of Week for Weekday/Weekend in the table. I get:
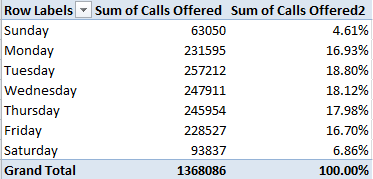
This bit of clarifying nuance exposes Sunday’s mere 4.61% of all calls, and also points up Tuesday’s modal call accumulation. Note as well the slow but vivid Tuesday-Friday diminution.
What about some seasonality? Substitute Date for Day of Week, grouping by Month:
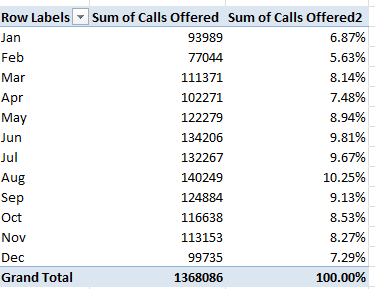
Again, the variation is substantial, with February callers the least vociferous, even controlling for that 29-day month. It’s clear that demand crested during the summer and troughed in winter, even in spite of the snow-fomented complications likely to beset a Canadian city (again, review the 311 home page for a taxonomy of complaint types.) But then again, Toronto, unlike say, London, is snow-ready.
A last look for now. Reinstate Weekend/Weekday into the Row Label area, empty Values, and roll in Average Talk Time (sec) (Summarized by Average, and formatted to say, two decimal points):
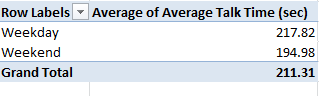
We see that, for what it’s worth, weekend calls took up notably less of 311’s time, about 23 seconds less, or about 10.5%; and those seconds add up across the workday. What explains the differential? Do weekend calls, perhaps concomitant with their sparsity, recount simpler, or at least more easily describable, complaints or requests? That’s a good question, if I do say so myself, and an answer would require a species of per-call data that hasn’t found their way into our spreadsheet.
Be that as it may, I hope to say more in part 2. In the meantime, let me put you on hold.

Leave a comment