You’ll have a grand time at the American university of your choice – about 30 grand, that is, and that’s for only one year’s worth of food fights, and all those other required credits. That promo is presented on behalf of the nation’s universities, who want you, or a loved one, or Uncle Sam himself, to burn that plastic until it starts to melt.
And you won’t feel any better when I tell you that my college stay was basically free, courtesy of New York’s City University and its long-since-superannuated tuition policy. But you’re likely to cheer up when you hear the update, though: that my alma mater, none other than Queens College, nowadays drops an invoice of about $5,900 on the notebooked laps of its enrolees, at least as of the 2012-13 year. I know that because I’ve called up the data from the Department of Education’s www.collegecost.ed.gov/catc/ site and its College Affordability and Transparency List, which I’m affording to you here:
You’ll see among other things that the workbook’s sheets report different data for different years, so you’ve been notified and keep that in mind, and you will want to inspect the Introduction tab for some important definitional background on key terms. In any event, the data are pretty serviceable, though they could stand a tweak or two.
Let’s begin with the eponymous Tuition sheet, totalling the annual costs for 4269 sundry institutions (can you get a football scholarship to the Professional Golfers Career College?) in 2012-13. I’d adjudge the code-bearing Sector field in column A surplus to requirements, as the actual rubrics for which the codes stand next door in the Sector Name field in B.
More problematic, though, is the data-obstructive fact that some schools are identically named – and while some of these are sister institutions (e.g., St. John’s College in Maryland and New Mexico), those kinships trouble the data just the same. Cropping the records with the ever-handy Remove Duplicates tool (by looking out for duplicates in the Name of institution field only, but not saving the reduced data set here; we merely want to know the very fact of redundancies) made 58 records disappear, but again we do want to retain all the nominal twins; they’re unique schools, after all.
And even as want to keep these same-names in our fold, we nevertheless need to somehow impart a measure of identificatory uniqueness to each and every school. The surest bet would be this: head on over to the J column, the data set’s first empty corridor, call it Unique Name, and enter in J2:
=E2&”-“&C2
That unpretentious string concatenation assimilates each school’s exclusive UnitID number to its name, e.g. University of Pittsburgh-Pittsburgh Campus-215293.
That works, but all those numbers aren’t pretty. Since the great bulk of school names are one-of-kind, we’d just as soon work with those, and string the UnitID only to those schools that need further distinction. I’d thus try this expression instead:
=IF(COUNTIF(E$2:E$4270,E2)>1,E2&”-“&C2,E2)
That is: if a school name surfaces more than once, call in that UnitID appendix. Otherwise, leave the name as we find it. Then concretize the results with Copy > Paste Special > Values.
Now here’s something else. Note the List A and List E fields in columns H and I, identifying tuitions (see the Variable values tab for elaboration) landing in the upper 5% or lower 10% of all schools, respectively. Schools in fulfillment of either benchmark are coded 1, with a 0 reserved for non-qualifiers. I find the columns curiously duplicative; it seems to me that the two discriminations could be made to co-exist in one field, by assigning 5-percenters an A and the lower 10-percent B, for example, after which a pair of simple COUNTIF expressions would be able to number both cohorts.
But either way, I’m confused. If you simply sum the the code-numbers in column H – the one ranking the upper 5% tuition charges – you’ll indeed realize216, or 5.06% of the school population. But filter the schools in receipt of that defining 1 and you’ll find a good many that aren’t remotely to be numbered among the top 5%, e.g. Minnesota’s Rainy River Community College, offering to teach you want you need to know you for a svelte $5,323 a year.
But that’s when I had my pint-sized Eureka moment. It seems as if the 5% metric redlines schools only within their sector, a decision rule I confirmed by some additional filtering. Thus Rainy River, a sector- 4, 2-year public (that is, governmentally-operated, as opposed to the British usage of the modifier) establishment, does in fact “merit” its high-end credential – relative to its institutional peers.
And once that insight strobes across our collective mindset, we can completely forego the sheet’s native Top 5 and Bottom 10% convolutions and pivot-table our way toward much the same. Try:
Row Labels: Unique Name
Values: 2012-13 Tuition and fees (Sum)
Report Filter: Sector Name
Once in place, select say, the 4-year, private not-for-profit sector. Then right-click somewhere in Row Labels and proceed toward Filter > Top 10… and continue:
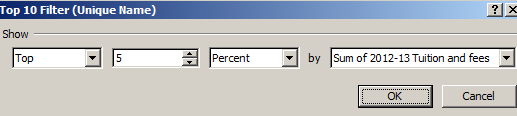
You may need to sort the tuition results descendingly, and you won’t really need the Grant Total. I get:
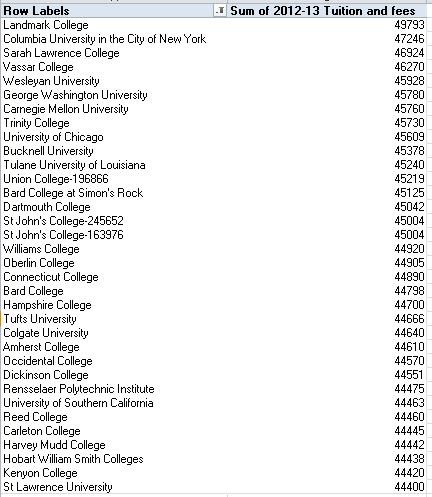
And no, I hadn’t heard of Landmark College, a Vermont-based institution wholly dedicated to students with various learning disabilities. I was also slightly, but only slightly, surprised to find Columbia University ensconced in second position, reflective perhaps of New York’s bumped-up cost of living. (If you’re wondering, Harvard asks for a bargain $39,966.) And note the two St. John’s Colleges, differentiated by their IDs.
And now you can play around with the permutations – filtering the various sectors for top and bottom tuition rankings. And if you’re looking for perspective, consider the objurgations flung at the British government for lifting yearly university tuitions to a maximum of £9000 (about $15,300) for a three-year, degree-culminating regimen. All told, in other words, that’s about $46,800. But that’s what Columbia charges for a year – times four.
So going to college? Start looking for a loved one – now.

Leave a comment