Now that last week’s spade work on the U.S. university tuition data has softened the ground for the next set of field trips (don’t worry; the puns and the metaphors stop here) we can proceed.
What, then, about some pivot-tabled, statewide breakouts of the tuition numbers? Start straightforwardly:
Row Labels: State
Values: 2012-13 Tuition and fees (count)
2012013 Tuition and fees (again, this time by Average, restyled by currency format). Then sort this column highest to lowest. In excerpt I get
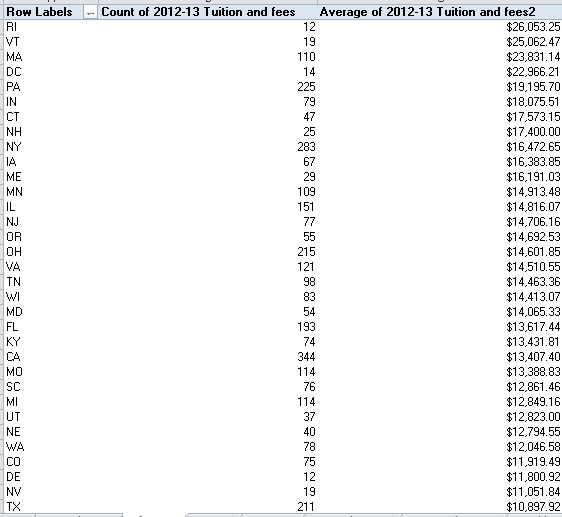
(Don’t rub your eyes at the math, or at the smallness of the text, for that matter. The 59 “States” grants a visitor’s permit here to various U.S. territories, e.g. the Virgin Islands and Puerto Rico, with its 98 institutions).
Rhode Island, Vermont, and Massachusetts, three states jigsawed into the New England region in the U.S. northeast, head the sort. But because tuitions ebb and flow by sector type that parameter needs a hearing. Drag away 2012-13 Tuition and fees (count) lift Sector name into Column Labels, and sort it all by the 4-year, private not-for-profit item. I get (again, in part):

This time four New England states – Rhode Island, Massachusetts, Connecticut, and Vermont – spearhead the list (trust me, if you can’t make them out up there). Old states (they’re all part of the original 13), old money, or something like that.
Then recalculate the data by Count, restoring the numbers to their General format. Note the refurbished results continue to hold to the 4-year, private not-for-profit sort, only this time hoisting New York to the top. Now show the values as % of Row Total. Don’t move away from the 4-year column and scroll down to Rhode Island and its 66.67% proportion, Vermont’s 68.42% and Massachusetts’s 60.00%. (Note: you can’t here sort the percent data by largest to smallest, because the item “really” continues to comprise the university count. % of Row Total merely masks the actual data as it was brought to the table.) Compare those states’ shares to those of other states, and the overall tuition averages can be more revealingly understood as a creature of the distributions of institution types across states.
But our workbook contains other data, too. The NetPrice worksheet rolls out real-world cost figures, performing subtractions from the stated tuitions as wrought by various modes of student assistance (again, review the Introduction tab for definitional enlightenment). You’ll need to note, though, that NetPrice carries 2011-12 outlays, and as such can’t truly be compared to the Tuitions sheet data, circa 2012-13. Note in addition the 130+ plus schools for which no net price data avail, and a smaller number of truant institutions – about 70 – showing blanks in their Percent receiving grant aid cells. (And don’t overlook those four schools flouting negative net prices, meaning they’re paying you to go there.) And I can’t quite tell if the net prices we see here typify only those students who have actually received aid, or all the attendees at a school – even the ones who’ve footed their entire bill.
Nevertheless, there’s a lot to work with, starting, for example, with a breakout of the percent of students receiving aid by sector, along with average net sector price:
Row Labels: Sector name
Values: Percent receiving grant aid 2011-12 (average, with appropriate formatting)
2011-12 Net price (Average, and suitable formatting)

An impressively large proportion of all students, then, receive some manner of outright aid; (the Net price description in the workbook’s Introduction sheet suggests the numbers above denote granted, as opposed to loaned, monies), with 4-year public institution enrollees the least likely to win a subsidy, perhaps because their tuitions are relatively low-ended to begin with. Still, students at the less than 2-year private not-for-profits and public school receive aid more often, and yet pay less tuition. And remember again that if you’re keen to compare net with initial tuitions, you’ll have to somehow ford the reporting-year divide distancing the Tuition and Netprice sheets.
Then simply sort the net prices from largest to smallest, a move that levitates the Aviator College of Aeronautical Science and Technology in Florida to the top floor with its net price of $71,492. You’ll remember the list-topping Landmark College from last week’s post, but that school asserts to its superlative standing only among its 4-year not-for-profit peers. The 2-year, for-profit Aviator College is the dearest of the dear; and what’s odd is that its 2012-13 tuition – presumably the figure assessed before any financial relief comes to the rescue – comes to $63,073, curiously lower. Of course, the numbers emanate from different school years to be sure, but a deeper look seems in order here, and while you’re at it, check out California’s American University of Health Sciences, the net price runner-up at $66,743. Its tuition for 2012-13: a nickel-and-diming $30,700. Explanations, anyone?
And for another set of thought-provokers, be mindful of the NetPriceChange sheet’s two comparison years, 2009-10 and 2011-12. It’s not unreasonable to wonder about that missing year in between, along with the sheet’s roster of 6843 schools, far outpacing the 4269 with which we worked in the earlier sheets. The respective sector populations by sheet:
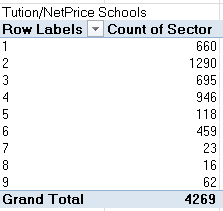

It’s sector 9 – the Less than 2-year, private for-profit institutions niche – that pulls far away from the same-numbered Tuition/Net Price entry . Someone needs to account for the vastly different counts here. And one of those 2-year schools, by the way, is Florida’s Eternity Cosmetology School,
But with a name like that, are you sure they didn’t mean Cosmology?

Leave a comment