They call it the city that never sleeps for a reason – New Yorkers can’t, not with that immutable racket banging a collective tattoo on the eardrums of the Apple’s yawning hordes. New York’s Open Data noise complaint spreadsheet makes for interesting downloading and reading, but try to grab a quiet seat in the library first before you give it a look. You can get it here (the workbook, not the seat), after clicking the laconically-named Noise link (listing 116, the one captioned NYC Noise complaints for 2012).
Download it as a CSV (perhaps the speedier mode), but save it as a duly certified Excel workbook; and sized at 62MB, make sure that seat is well padded during your wait, while your hard drive reels from the impact.
Interesting, not a little amusing, but yet occasionally reproachable, the data indeed require a look, and a well-considered one. For example – given their peculiar informational relation to time sensitivity, complaint records would serve investigators smashingly with date and time stamps, and the Created Date field in B comprises the former only; and while the Due Date field entries are in fact properly time-laden, the meaning of a due date is unclear (to me at least), and incomplete besides.
And don’t confuse the City and Borough fields, the latter strictly admitting just the names of New York’s five counties (boroughs). The City field, however, granularizes its Queens references, drilling only these down to their neighbourhood names (a common New York postal practice, by the way) and hence subverting any inter-borough comparability.
Moreover, columns AA through AW don’t seem to belong here, having either been abandoned, headed by extraneous field names, and/or stocked with the Unspecified code. As such I’d delete the whole lot, and show the door as well to that very last Location field, which textualizes latitude and longitude information that’s already there, and in far more usable form in the immediately preceding columns. Overall byte saving as a result: about 18MB. And I don’t suppose you need reminding about the ubiquitous column autofit.
Now you can replace your hard hat with a thinking cap; there are data in there, after all. Start basic: how were complaints distributed across 2012’s months? The pivot table prescription is clear:
Row Labels: Created Date (grouped both by Months and Years, that latter qualification a probe for misfit records dated a year other than 2012).
I get:
![]()
Hold on. We’ve been told that our original 62 million bytes devoted themselves to 2012 data, and we’re seeing an awful lot of months joining in from following two years as well. Let’s see how many seditious records we’re dealing with, by dragging Created Date (perhaps kicking and screaming) into Values. I get:
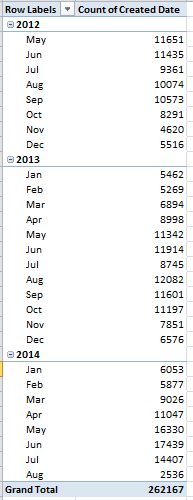
In other words, we’ve been fooled, kind of. The data in fact begin in May 2012, but roll on nevertheless all the way to this very week. And that’s fine with me, but let’s just understand the time span we’re really dealing with.
One distributional fact calls attention to itself right away. Note the apparent step-up in complaints for 2014; and for a more fluent realization of the same, drag the Years button into Column Labels (yes; Excel lets you break the Months and Years strata of the same grouped field into its two sub-parameters, although you’ll note that what is effect Months remains labelled as Created Date, a bit opaquely):
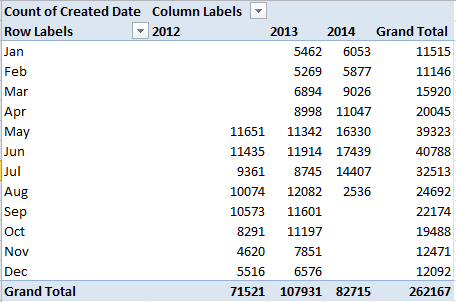
We see that this year’s May, June, and July complaint numbers push well ahead of their prior monthly counterparts (and August looks to be similarly paced), setting off the usual methodological caution: is the upsurge a creature of a sharpened acuity in New York’s recording tools and/or a heightened litigiousness among New Yorkers, or a “real” pumping up of the volume by New York’s noisemakers?
Now for another standard take, try associating complaint numbers by borough:
Row Labels: Borough
Values: Borough (Count, as it must)
Borough (again, by Show Values As > % of Column Total):
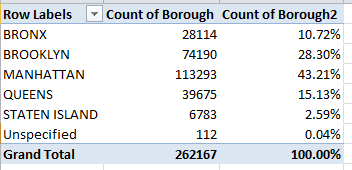
Remember that Manhattan’s residential population of 1.6 million accounts for less than 20% of New York City’s total, but its effective daytime midweek population trampolines to around 3.6 million. Thus again a reliable reading of complaint times would do wonders for the analysis. For a first pass at the problem, while conceding the uncertainty assailing the Due Date field, try
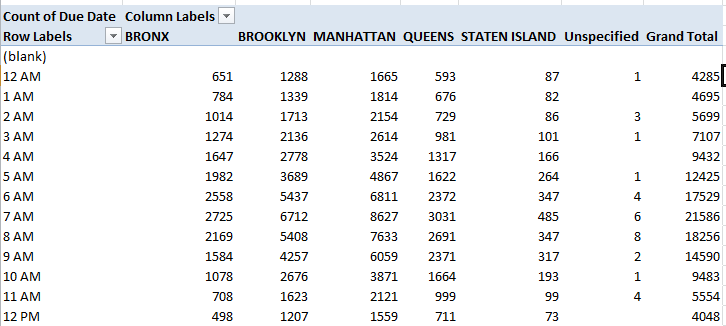
Row Labels: Due Date (remember, the field contains many blanks. Group by Hour)
Column Labels: Borough
Values: Count of Due Date
I get (in excerpt):

Note the Manhattan totals, particularly between 5 and 7 AM. Boisterous clubbers in, or out there? Late-shifters tuning into their boom boxes at quitting time? I don’t know, but next switch these numbers to % of Row Total mode, filtering out the blanks and turning off Grand Totals (which necessarily will add to 100%):
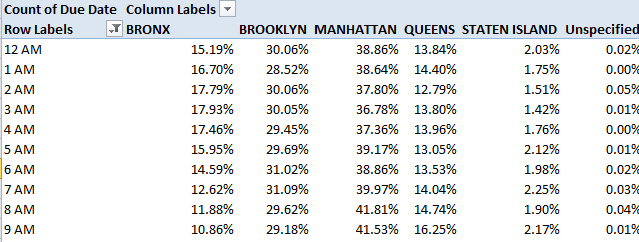
With 43% of all the complaints, the early-morning proportions don’t seem to incriminate Manhattan. But on the other hand, would anyone want to allow that Manhattan’s 3 AM population stands at 3.6 million?

Leave a comment