Now that we’ve implicated Manhattan as the noise complaint capital of New York City – if not the world – it’s time to add some counts to the arraignment. We could for example drill down complaints by the zip (or postal) codes of city’s five counties, or boroughs, for the sake of intra-borough precision – something like
Row Labels: incident Zip
Borough (shown in Tabular format, with the subtotals suppressed)
Values: Borough
Proceed to filter out the blank zip codes, and note the smattering of codes, e.g., 10463 and 11237, drawing their outlines around parts of two boroughs (and remember that by clicking anywhere in Incident Zip and following with PivotTable Tools > Options > Field Settings (in the Active Field button group) > Layout & Print > Repeat Item Labels, you can fill the Incident Zip blank cells with their codes). That 83 code in receipt of 126 complaints, doesn’t square with the U.S. five-digit protocol and seems to reference points in and around Central Park.
Then right-click in Incident Zip, click Filter > Top 10, and ask for say, the 15 prime code offenders -and you’ll have to sort these; because Top 10 won’t do so on its own.
And for a few words about that sort, as I (presently) understand it. Because we’re effect conducting a two-field (Incident Zip and Borough) breakout of the Values, a direct click in and sort of those Values won’t happen here, as it would in a conventional data set. And that’s apparently because the two fields lock their Value up, such that the Value can’t be independently sorted among its peers. The value (4450) for Incident Zip/Borough 10025/Manhattan, for example, is only sorted against itself – that very, singular concatenation of 10025 and Manhattan, and not the remainder of the values, which sort against their own unique Incident Zip and Borough. You thus need rather to click in the superordinate Row Label– in our case Incident Zip – and right-click on Sort and More Sort Options:

We do want to sort Count of Borough descendingly (highest to lowest, even though the dialog box insists on Z to A). But we’re doing so only after having clicked somewhere among the controlling Incident Zip Row Labels. And no, it’s not obvious. And to thicken the matter, were only one field to populate Row Labels, you would be able to click directly into the Value area and sort it. And no, it’s not obvious.
Anyway, you’ll go on to note the not-unpredictable Manhattan predominance among the complaint bearers, but here’s where it helps to know a bit about New York neighborhoods – because most of the areas keyed to those clamorous zip codes are residential, and not the commercial beehives you’d expect to find ruling the noise hierarchy. Zip code leader 10032, for example, maps to Washington Heights in the borough’s upper latitudes, right where the island begins to literally thin; 10002, on the other hand, or other side, pinpoints the fabled Lower East Side, no more renowned for its commuter and business-driven demographic than 10032. Indeed – only zips 10016 and 10019 could be properly sited in Manhattan’s teeming center, and the Brooklyn-interloping 11211 plots itself in only-in-New-York Williamsburg, that incomprehensibly polygot Chassidic-Hispanic-uber hipster turf on the other side of the river. More hipster heavy partying there than heavy industry.
If we’re dealing then with an anomaly of sorts – residential noise chart-toppers – we’d do well to cast for a wider breakout, by complaint types. Those data here are doubly categorized, both in Complaint Type and Descriptor terms, with the former grouping the more particularized citations in the latter field. But Complaint Type encrypts a great many of its entries as just plain Noise, not affording much aid and comfort to the analysis, and as such we’ll have to go with the more closely-itemized Descriptor field. And because the Descriptors are so numerous and will shove many of its columns off screen, let’s swing Incident Zip and Borough to Column Labels and lower Descriptor into Row Labels, e.g.
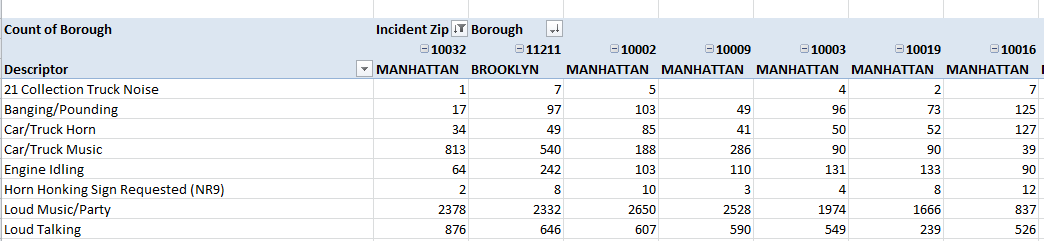
Note those large Loud Music/Party numbers. For substantiation, jostle the data by % of Column Total and take particular note of 10016’s Loud Music/Party count, amounting to 18.68% of all its complaints, the smallest such fraction among the 15 zip codes. Again, 10016’s perimeters take us just beneath the Empire State Building and the United Nations, that is, very near a relatively (and it is all relative) daytime-top-heavy, tourist and worker-intensive territory. On the other hand, 10016’s proportion of all its complaints filed against Construction Before/After Hours – 32.77% – takes it to the head of that class, again attesting to its commercial locus.
But if you’re looking to party, you’ll find the buzz in Manhattan’s 10034, way up in Inwood, a ‘hood pushing even farther north than Washington Heights. The Loud Music/Party count screams out 60.62% of all the complaints leveled there.
Now for another look, one that pitches Descriptors to day of the week. Pile into the next available free column, call it Weekday, and enter in row 2:
=WEEKDAY(B2)
(And while you’re at it, you’d probably want to Paste the Values atop the formula results. And remember, 1 means Sunday.)
Then:
Row Labels: Weekday (Count)
Weekday (again, this time by % of Column Total)
Slicer – Descriptor
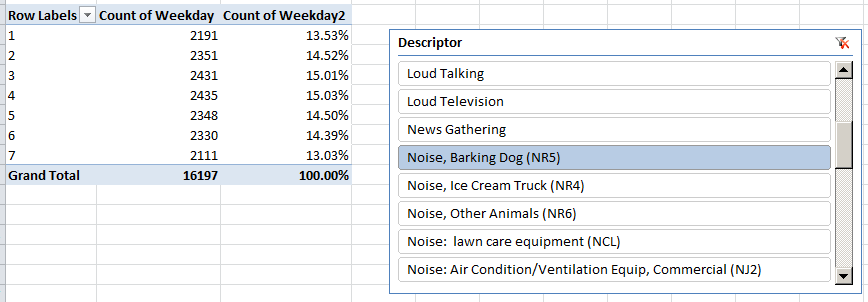
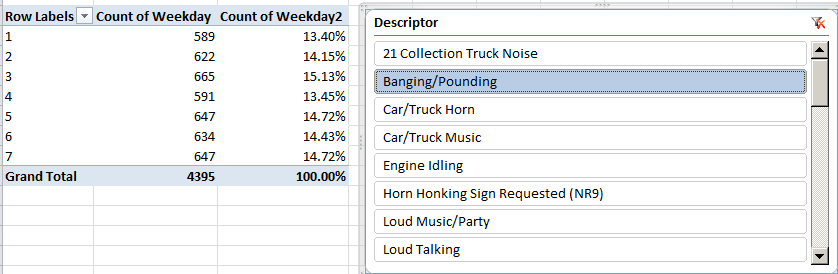
Click through the Slicer’s uproarious inventory, e.g., Banging/Pounding, Loud Television, News Gathering (you’ve got me on that one), Jack Hammering, and the like, and observe both the absolute and relative distribution of each descriptor across the week. And the variation can be intriguing, though the 16,000 barking dog complaints track even-handedly, as do all the Bangings and Poundings, e.g.:
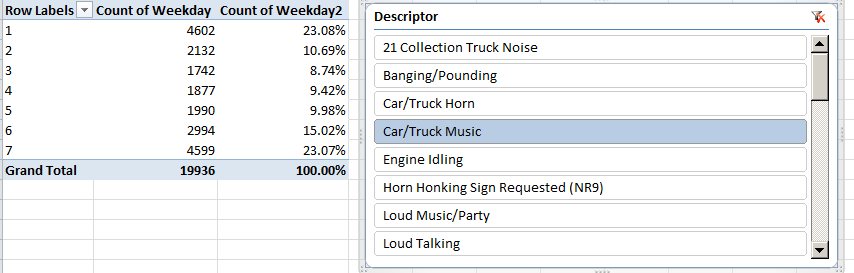
But Car and Truck Music protestations exhibit weekend sensitivity:
Well that’s New York – its folks seem to be either partying or complaining. And maybe the complainers are complaining because they weren’t invited to the party.

Leave a comment