Now that the UK parliamentary election has come and gone it’s time; not for a recount, because even Labour isn’t going to the barricades on this one, but rather a recount-ing of what happened, and where it did. And if it’s detail about the votes you crave you’ve come to the right place, namely this workbook put together by the electionresources site (and you’ll find election data for quite a few countries here):
http://electionresources.org/uk/
(Click the May 7, 2015 link).
The outcomes of all 650 House of Commons contents and their 3971 contestants, some bearing party affiliations of which you’re likely to hear for the first time, come right at you, auguring some interesting analytical prospects, and some questions too.
Beginning with the prosaic but necessary housework, you’ll need to spruce up the field headings in columns B and G that just aren’t there. I think it’s clear that the Constituency header in A was really dedicated to B, and so I’ll move it there, and name the vacated A field Number. Column G clearly computes the percent of respective constituency turnouts, thus earning the name Pct. Turnout or something like it.
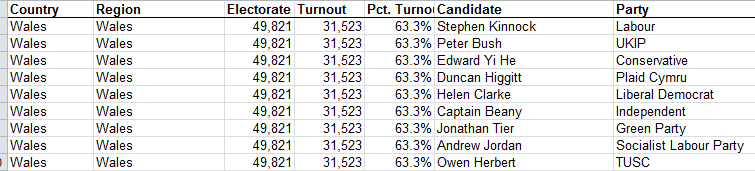
And it’s that Electorate/Turnout zone that throws an organizational – that is, spreadsheet-organizational question – at us. You’ll note the redundant Electorate, Turnout, and Pct. Turnout numbers/percentages counted off for each candidate in his/her constituency, and the clear failures of these spare parts to teach us anything new beyond their first mention:
Nevertheless, leaner alternatives do not come easily.
What does that mean? Start with the Turnout data, recording the absolute numbers of constituency- eligible voters making their way to the polls. Apropos the first-listed Aberavon district in Wales, its row 1 turnout figure of 31,523 is obviously in no way enhanced or value-added by the eight additional recitations of the number attaching to each Aberavon candidate. But how else, then, could turnout be represented?
The answer to that quasi-rhetorical question depends – again – on who’s doing the asking. For seekers of novellae among the data it seems to me that this pivot table:
Row Labels: Constituency
Values: Votes (Sum)
Does the work of Turnout, and because it does, it frees us to retire Turnout from the dataset altogether. If on the other hand, you’re merely inspecting the numbers, Turnout may have an edifying role to play in the presentational scheme – though even here I’d submit the percent of turnout is what most readers really want to know; and if that be the case, Turnout could still be responsibly evicted from the sheet.
But that fix remains partial, and doesn’t look the problem squarely in the eyes, i.e., how to integrate what are in effect aggregated data – overall turnouts – with individuated records made to dangle their toes on the same row. The problem is apples/oranges, or, if you’re a UK voter, chalk-and-cheese: i.e. specific, per-record candidate results having to live with what is in effect subtotal data in the Electorate and Turnout fields. It’s one thing to derive constituency turnout from the records, as the pivot table above succeeds in doing easily enough. But it’s quite another to calculate the numbers of eligible voters on the basis of the actual vote totals we have. I’d venture to say it’s impossible, and because those eligibility numbers have to be supplied exogenously electionresources.org obviously chose to simply post them in each and every record, bad form notwithstanding. I’m not making a citizen’s arrest, mind you; I’m simply alerting the authorities to the problem.
In any case, interesting conclusions from the data are nevertheless there to be drawn, once you begin to look at them. For example – we see that the Place field furnishes each candidate’s ordinal finishing position in his/her race, and so we could pivot table a party’s average race position, as it were:
Row Labels: Party
Values: Place (average, formatted to two decimals, sorted Largest to Smallest)
I get in excerpt:

Lots to be learned here, not the least of which is something of the 129 parties wanting to stand up and being counted, including the World Peace Through Song and the Birthday parties, two entrants that might do well to consider coalition. And Plaid Cymru means the Party of Wales, intending no fashion commentary. Note as well the top-ranked Speaker party comprising precisely one candidate, House Speaker John Bercow, a Conservative who assumed this singular affiliation in consequence of his role (and I know no more about this curiosity than what I’ve just told you).
But Speaker Bercow’s one-case universe won’t satisfy your inner pollster, and so by dragging Place into Values again in order to tally candidate numbers, and summarizing by average, you’ll see (again the screen shot is fractional):

Here the relationships get a bit more definitive. The Scottish National Party’s (SNP) near-perfect 1.05 builds itself on the back of its Scotland-specific candidate cohort of 59, 56 of whom actually won. And we see the fuller contingents of the Conservatives and Labour exhibit pretty comparable place averages, even as their respective MP numbers stand at 330 and 232.
Those misshapen place-average/MP fractions get all the more gnarled when you slip Votes into the Values area as well and show them as % of Column Total (you’ll need to format these to five decimal places in order to bring the percentages for small parties to light). The perennially controversial UKIP made much of its one-member victory, an isolated triumph emerging in spite of the party’s 12.6% of the nationwide vote. Its calls for proportional representation likely won’t be heard – though even Labour, with 83% of the overall Conservative vote and but 70% of the Tory’s MP total – might want to think twice about the idea, too.
But the on-top Conservatives, with 50.7% of all MPs and but 36.8% of the vote, won’t even think about it once. And the SNP, with 9% of the MPs and 4.7% of the UK electorate -and only 49.9% of the actual vote in Scotland itself, by the way – won’t either.

Leave a comment