Please tell me you understand the pun. If you don’t, you’ll have to indulge my word-playing nod at the slang for cab driver, apparently inspired by the Hackney horse, a London equine precursor to motorized livery.
Etymology aside, the New York Open Data site has parked a set of titanic data sets in its garage, each presuming to log the outcome of each and every taxi ride hailed during the first half of 2015. In fact, activity for two varieties of taxi have been committed to the record – the storied yellow cab of stage and screen, and the newer, less-celebrated green fleet, its myriad of cars rolled out in order, according to the city’s Taxi and Limousine Commission, “to improve access to street-hail transportation throughout [the city’s] five boroughs – especially for persons with disabilities and people who live or spend time in areas of New York City historically underserved by the yellow taxi industry”. Indeed – the green-cab ambit excludes the traditional New York taxi bailiwick south of Manhattan’s 110th Street. Our data, downloadable via the first link above after which you’ll click the 2015 Green Taxi Trip Data link (ignore the caption there insisting the data emanate from 2014), eyes ride data for but the first week of the year; its 284,390 records tells you why Excel won’t be able to accommodate all the year’s trips to date, and so no claim to representativeness can be advanced as a result. Still, 284,000 rides ought to be able to teach us something.
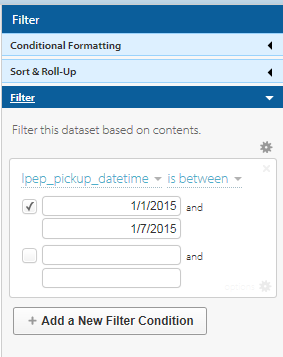
To snare just those first seven days, click the blue filter button and apply these conditions:
One there, we should be able pose some standard, but interesting questions of the data, turning in the first instance perhaps on trip duration and fare data. To learn something about the former I’d drop a column after B (Lpep_dropoff _datetime, call it Duration, and write, in C2:
=(B2-A2)*1440
1440, because Excel figures time data as an elapsed fraction of a day. Reformat B2 in Numeric terms, for example, and you’ll see 42077.24, with the .24 expressive of 5:41 AM – or 24%, as it were, of January 3. Multiply .24 by 1440 – the number of minutes in a day – and that restorative tack yields the number you want to see here – 345.6 minutes, or 5:41. And if you respectfully submit that 345.6 minutes really comes closer to 5:45 or thereabouts, you’d be right; we can lay the discrepancy to the fact that the workbook rounds off to .24 what is in actuality .236805555…. And the time in cell B2 is really 5:41:30, besides.
In any case, you can copy the expression in C2 down the rest of the column the requisite 284,000 times, and for starters perhaps you should. But our explanatory digression has whistled past a deeper problem. Look at the result in C159, for example. Here we learn of a fare that embarked on his/her appointed round at 12:32 in the afternoon on the 4th of January – and completed the sojourn at 1:02 AM on the same day, a cosmologically breathtaking -689.33 minutes.
But before we put the matter to the relativity theorists, some absolute common sense could be brought to bear first. It appears as if the workbook has made a mistake of sorts, by failing to negotiate the noon and midnight chronological breakpoints that reset times back to 1 o’clock – both AM and PM. It’s clear that the ride in row 159 means to describe a trip that disgorged its passenger at 1:02 PM, or a half-hour after the meter started to run; and if that be the case, the record’s stated drop-off time is obviously wrong, and don’t think the mathematical disconnect follows on some computer-based regional formatting loss in translation, either. The ride data present themselves just that way in their native web source.
Now look at the data for row 187, bearing the details of a run commencing at 11:51 AM on January 6 and pulling into its port of call at 12:00 PM on the 7th. Now while a ride of 24 hours and nine minutes isn’t quite unimaginable, its 2.5-mile (I’m assuming the Trip_distance field measures miles) locus across even the most traffic-jammed of city streets, and for a fare of 10 dollars, doesn’t quite add up. Far more likely, or course, is the ride’s end at 12:00 on the 6th, amounting to a sense-making nine-minute journey.
In the service of clarification, then, I copied our original formula down the Duration field and sorted the numbers Smallest to Largest. I found 5179 negative durations, along with 2496 trips checking in at 300 or more minutes, nearly all over 1000 minutes. Moreover, 182 trips clocked exactly 0 minutes, most but not all of these recording a trip distance of zero miles but yet in most instances assessing a fare charge. It’s possible these latter outliers signify idling cabs whose passengers never appeared or thought better about taking a ride, but a few do display distances allegedly traveled, including a 16.25-mile jaunt on January 4th costing $48.00 and yet taking zero minutes to complete. Now you can bring in the relativity folks. But time/space conundrums aside, my inclination is to delete these zeros; their unpredictable travel data suggest these entries are nothing but flat-out mistakes.
But because the extreme travel durations – both negative and triple-digited – seem to vary systematically, some formulaic ways out might avail here. Start with the negatives. I’d rework our primeval expression in C2 this way:
=IF(B2<A2,(B2-A2)*1440+720,(B2-A2)*1440)
The above rewrite asks if the ride’s drop-off time-stamp precedes the pick-up time. If so, a corrective of 720 – or 12 hours in minutes – has the effect of returning the drop-off time to its proper chronological standing, e.g., 1:05 AM becomes 1:05 PM, and the accompanying subtraction then seems to work. And now you can sort the durations Largest to Smallest, because the zero times now fall to the very bottom of the pack instead of somewhere above the negatives, and can be separated from the usable durations by our proverbial blank row.
That patch seems to do what it set out to do, leaving us now to attempt a salvage of those lengthy, two-day-spanning trips, a task textured by the very real possibility that some rides really do begin late into one day conclude early in the next. Remember that we’ve just sorted the durations from largest to smallest, lifting the long trips to the top of the column, and after a bit of consideration of these data miscreants, a bit of pattern began to resolve.
First, a good many rides feature a drop_off time of precisely 12:00:00. Most of these are surely errant, and probably deserving of deletion. But how can we properly, and swiftly, sight them among the 284,000? I’d try something like this: improvise a new, temporary column called Noon alongside Duration (or really, anywhere) and enter, in its first cell:
=IF(B2-TRUNC(B2)=0.5,2,1)
That’s TRUNC, as in truncate, a function that, according to Excel, “truncates a number to an integer by removing the decimal, or fractional, part of the number”. Thus our formula asks if the tested cell entry, minus its truncated value, equals precisely .5, or half of a day, or 12:00 noon. If it does, the expression returns 2, and otherwise, 1. Then sort the Noon column Smallest to Largest and jam another blank row, this one right above the 2s (of course this routine has the effect of triaging any real rides that happened to have come to rest at exactly noon, though that likelihood is dim).
Ok – there’s still more data cleansing to do, but I’m calling it a day. Will someone call me a cab?

Leave a comment