If you can get there from here you need to know the way, and the time it’ll take for you to connect the dots. And if you’re planning a trip to London’s Bank/Monument tube station in the City of London – though, true, if you’re reading this in Omaha or Milan you probably aren’t – the London Data Store (don’t be daunted by the name – the goods are free) is handing out a workbook that estimates the travel time via any one of four modalities – car, public transport, cycle (assumedly bicycles, that is), and foot, to that underground byway (the eighth-busiest in the system, at least according to Wikipedia) from any one of the city’s 25,000 Output Areas (OAs), very small parcels of turf (needless to say) that should enable us say something about the journey. You can download the workbook here; click the MyLondon_traveltime_to_Bank_Station_OA link, storing a CSV file that should open directly in Excel.
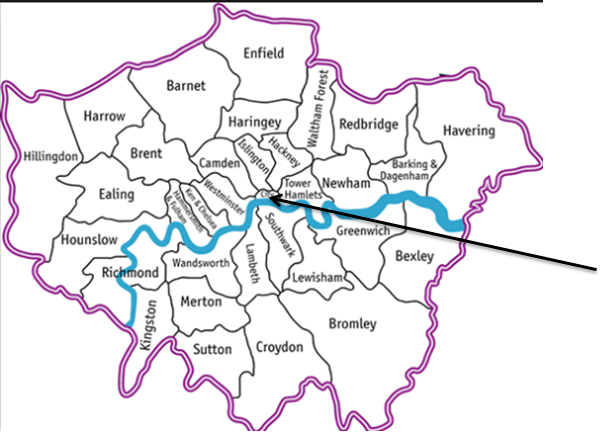
But before we get to say anything a prior question needs to be posed. Every from has a to, and the distance-time records in the data set start us off from a coded OA; and unless your London city smarts are frighteningly acute you won’t know the actual names of any of those minute “froms”. But we’re in luck; identifications are available in another Data Store workbook, the London Summary file (on the same page as the Bank Station workbook), which pleasingly lines up each OA with its London borough name, and in the same sequence as we have them in our travel log. Thus we can break open a new column alongside A, call it Borough, and copy and paste the names straight away therein. And for some additional orientation, the boroughs map this way (source: http://directory.londoncouncils.gov.uk/ The arrow points to the City of London, in which the Bank station disgorges its madding crowd.):
But with that mission accomplished some prefatory words about the data need be spoken. The great majority of walking distance entries – about two-thirds of them – report a zero mileage, but with due cause. The workbook compilers determined that, because a walk to the Bank station is prohibitively long from so many OA starting points, no calculations from these places of embarkation were essayed at all. Indeed, sort the data set by walking_time_mins largest to smallest and you’ll boost the 120-minute figure to the top of the field – the data’s way of telling you that no estimated walk to the Bank stop exceeding two hours would be considered. (You’ve also noted that the public transport field has no distance_miles companion, perhaps because the traveller has no discretionary, optimized route to compute, and/or the line-transfer requirements for some rides to Bank Street skew the mileage accumulations.)
Note too that the driver/cyclist distance reckonings rolling out from the same OA often diverge strikingly. OA E00014858, for example, marked out in the west London borough of Kingston on Thames, reports driver miles of 42.48, even as the measure for cyclists comes to a trim 19.27. Data entry error, or a reflection of radically different directions toward the Bank? I suspect these disparities embody the latter, but we’d need first to take a harder look at how these respective routes have been plotted.
Moreover, the available real walk distance/walk times evince a near-perfect correlation – .99 to be more exact – simply because the workbook appears to assume a more-or-less constant stroll time across London streets (coming to around three miles per hour) after taking into account the standard, all-but-constant run of obstructions, e.g., traffic-light pauses and the like. Thus the walk data are rather…pedestrian. Sorry. (Note: for a discussion about building a conditional correlation, e.g., correlating rows containing values other than zero, look here.)
And while it’s a bit less clear for the cycling data, but because the maximum cycle time likewise tops out at 119 we can again assume that the 238 zero-distance cells there mark OAs that would require a travel exceeding the two-hour threshold. And because it again seems as if London assumes equivalent travel conditions enfold cyclists across the city, the distance/time OA correlation here checks in at around .98.
And that leaves us with transport of the four-wheeled kind. Because auto traffic is beholden to notably different driving environments – variously fluid highway and city-street pathways to the Bank stop, and modulating speed limits, for example – the distance/time correlation for cars could be projected to shrink, and it does, pulling back to a .83 association. That’s still very high by social-scientific expectations, for example, but .83 isn’t .98. And as such, we could seek an additional association – say between the length of the trips to Bank and their average velocities. Might a longer ride, heading out from an OA somewhere in the city’s outer region and availing itself of the relative alacrity of a light-free highway, proceed more speedily to its destination?
Let’s see. It seems to me that by totaling driving distance times by borough and dividing them by their total driving times, the resulting mile-per-hour readings should tell us something instructive about the comparative pains drivers need to take in order to get to Bank (and quite apart from the prior question as to why someone would actually want to drive smack-dab into the heart of Europe’s largest city). It stands to reason that boroughs bearing larger distance OA aggregates are farther away from the Bank, and so their mile-per-hour quotients could be interpreted in that context (I should add that the problem of weighting records by their relative size, e.g., equating per-capita incomes for countries of different populations, is properly treated as a non-starter here; I can’t image a cogent reason why on-the-ground OAs can’t be accorded mathematical parity. Each presents a literal, available point of departure for someone’s commute, after all).
We can begin, then, by commissioning this pivot table:
Row Labels: Borough
Values: Driving_distance_miles
Driving_time_mins (both summarized by Sum)
And where’s where you need to exercise your pivot-tabling savvy. Because we’re interested in reading the average trip speeds as miles per hour, and because the time data communicate themselves in minutes, we need to translate minutes to hours via a calculated field, which I’ll call MPH. It looks something like this:
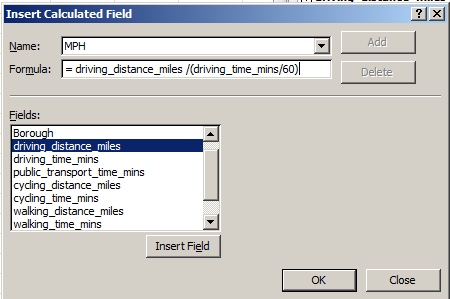
That 60 divisor expresses the driving minutes in hourly terms (45 minutes is .75 hours, for example). Click OK and format the results to say two decimals:
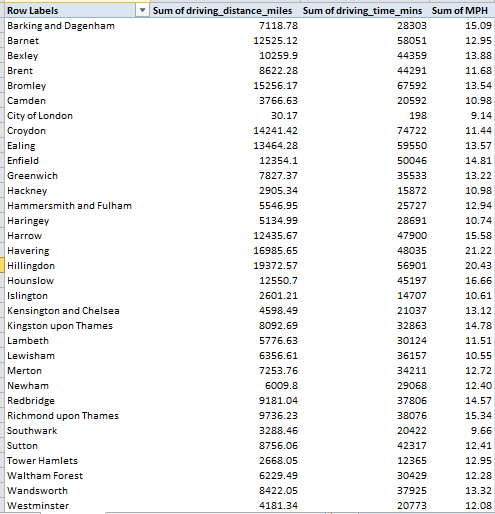
(You may want to rename Sum of MPH as MPH. Remember you can overwrite existing entries in pivot tables’ Labels areas.) Then sort by MPH, and you’ll find the boroughs of Havering and Hillingdon – both at quite a remove from the Bank stop – facilitating the swiftest trips to the station. It’s additionally noteworthy that the miles-per-hour for the City of London borough (again, not to be confused with London in its massive entirety) – the home of the Bank stop – is in actuality the slowest, nothing if not a little ironic. In fact the overall correlation between aggregate borough miles and miles per hour returns an impressive and revealing .76. That doesn’t mean of course that the OAs furthermost from Bank actually get you to Bank sooner; it just means the cars setting out from there move more quickly.
On the other hand, cities being what they are, what can we say about a vehicular means of getting about in which the paciest trip spins along at 22 miles per hour?
Anyone know where I can get a used hoverboard, cheap?
On the other hand, cities being what they are, what can we say about a vehicular means of getting about in which the paciest trip spins along at 22 miles per hour?
Anyone know where I can get a used hoverboard, cheap?

Leave a comment