Put your mind to it, and you can learn a lot from 624 records, not coincidentally the number of urban development projects placed before the all-comers electorate (no age restrictions, you’ll remember) in Paris’ 2015 Budget Participatif referendum. 77 of the proposals opened a Paris-wide scope on their plans, while the remaining 547 drilled their intentions down to the arrondissement level (though some of these, however, subtended multiple arrondissements).
So what is there to learn? One simple but instructive peg upon which we could hang the data would have us break out winning and losing project proposals by their anticipated expenditures. This pivot table comes to mind:
Row Labels: Projets Gagnants / Non retenus (Winners/Losers)
Values: Montant (i.e., budgetary amount earmarked) (by Average).
I get:

We see, provided I’ve understand the numbers, that referendum winners averaged considerably lower apportionments than the ones voted down. That finding, on the other hand, would appear to amount to more – or less – than a collective press toward austerity. After, the project monies had been rolled into the arrondissement budgets, and so were already in place and available (the Participatif page’s Projet 2015 link opens to descriptions of the 624 proposals, translated or otherwise). Why , then, that the more frugal projects tended to prevail is a question that remains yet unanswered. A reflexive voter aversion to the cheaper rather than the dearer? I don’t know.
Another pivot table natural would urge a scan-through of winners by theme or project category (again the Project 2015 enumerates these in English, should you opt for Google Translate or your local bilingual French ami). We could try something like this:
Row Labels: Theme
Column Labels: Projets Gagnant /Non retenus
Values: Theme (Count)
I get:
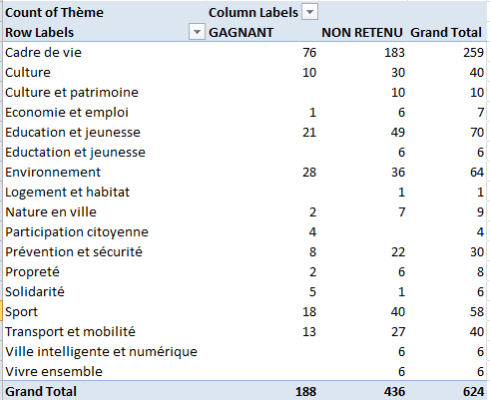
We can now see how the numbers of proposed and approved projects align by theme. The undisputed ruler is Cadre de vie – Living Environment, contributing 41.5% off proposals, and 40.4% of the winners, a notable near-one-to-one association that holds across many, but not all, the themes. Note too the all-losing ten proposals under the Culture and Patrimonie (heritage). Want to read something into that? Check it out, intrepid reporter.
To instill more sense into the above, we could show the values as respective percentages of the Row totals (and again, you’ll want to withdraw the Grand Totals from the sheets; they all add to 100%):
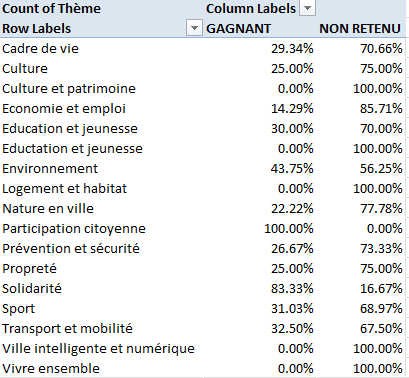
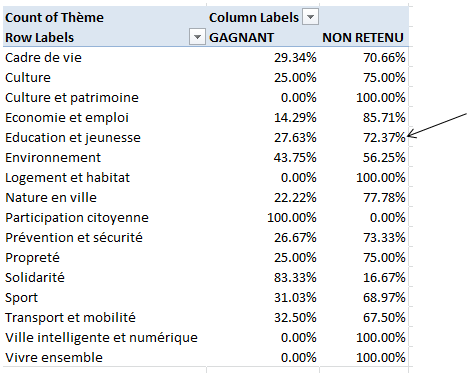
We see Environnment-themed projects exuding a disproportionately winning appeal, but don’t be fooled by the Education et jeunesse (youths) numbers. There’s a clear typo in there, one misspelling Education six times with superfluous T’s, and all besetting Paris-wide (Localisation 7500) entries. You’ll need a Find and Replace here, too, and when you rerun the pivot table you’ll see:
And as for winners and losers broken out by arrondissement:
Row Labels: Localisation
Column Labels: Projet Gagnant /Non retenus
Values: Projet Gagnant /Non retenus
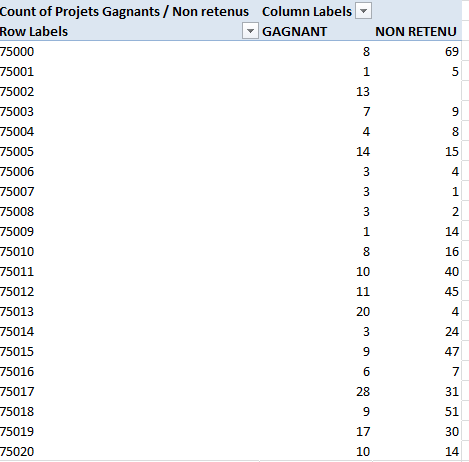
Here the win-loss fractions seem determinedly unpatterned. Only 10.7% of the city-wide proposals earned their keep, while voters in the 17th arrondissement were happy to approve 47.5% of their 59 ideas and the good people of the 5th arrondissement on the other side of town ratified 48.3% of theirs. The sentiment in the 2nd, however, was incontrovertibly unanimous; all 13 projects put before their denizens got the thumbs up, even as the folks in the 11th and 12th arrondissements liked but 20% and 19.6% of what they saw.
How these differences might be reconciled and understood is a next question that might merit a concerted follow up. It probably won’t do to write off these data with an explanatory plea to random variation, at least not without exploring the sentiments and project ideas attaching to each arrondissement. Remember that about 30% of all proposals won their remit, although that figure was presumably and in effect fixed by the monies made available in the referendum. If we confine our scrutiny to the arrondissement-specific proposals the win rate steps up to 32.7%, but in any case an assertive interpretation of all the victories and defeats would of take the analyst beyond our pivot tables, and there’s nothing wrong with that.
I’m just trying to be helpful; and if Paris’ mayor Anne Hidalgo wants my counsel on the matter, she knows where to reach me. I’ve told my people to let the call go through.

Leave a comment