So fledging that it’s still in beta, the European Data Portal sweeps across Continental government web sites, reaping gobs of data sets on all sorts of themes, and file formats, and languages (see this mini-directory of data sources, and from where I learned of the Portal).
It’s a vast bazaar of holdings, many of which hold a spreadsheet tag; and not a few seconds after launching my introductory stroll through its aisles was I brought face-to-screen with a workbook – the very first listing behind the Education, Culture, and Sport link, in fact – that details, of all things, patron visit data for the libraries of the London borough of Barnet, the part of the world in which your friendly blogster resides, and one of whose libraries from which some of these words have emanated:
And you can download it right there. (Don’t look for a link actually entitled Download, by the way; after clicking the above you’ll have to click the spreadsheet link on the page that follows, after which you’ll need to tap into the Go to resource link on yet the page after that.)
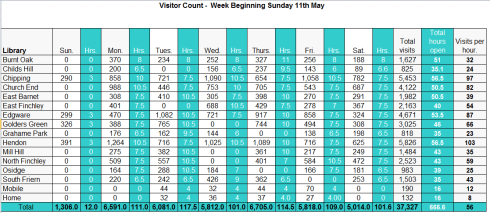
And once you’ve navigated that gauntlet you’ll have opened a nothing-if-not-remarkable workbook. More than 50 sheets, each one breaking down visitor data for each week of the British tax year (it starts on April 6) for each of Barnet’s libraries, proceeds to count the numbers, e.g.:
Remarkable, because staking a week’s worth of activity across a year of worksheets might – or might not – be the very last way one would aim to construct a workbook.
Now if you’ve probably found that equivocation pretty remarkable, allow me to explain, though be advised we’ve trod this terrain before. On the one hand, if you’re happy with the data just as they stand – and to give credit where it’s due the workbook agglomerates the weekly figures into monthly summaries, and moves to furnish the denouement as well – a set of yearly visit totals, all plotted in the April to Mar sheet – then there is nothing more to be done.
But if you want or need to teach the data a round of new tricks – say, a simple filtering of visit activity by month or an arraying the twelve months in one worksheet, or building a running total of visits by branch by month – you have a bit of a problem. The business of aggregating and re-aggregating the data in the service of these and like intentions – in other words, seeing to it that all the year’s data find themselves in one sheet, from which all break-out operations could proceed, including, but transcending, the results we already see in the workbook – could get rather messy.
Moreover, the sheets’ current field apportionments – in which hours of operation data are pinned to each of the week’s seven days, i.e. dispersing into seven fields information that should be concentrated into one – reads wrongly. Same data, one field, it seems to me; or else how can any subsequent analysis of that field press ahead?
And indeed – the Total Hours Open calculations run through in column Q, e.g.
=C5+E5+G5+I5+K5+M5+O5
require a leap-frogging of the non-hour (that is, the day-of-week fields) columns in order to properly reference the hour totals, as does, by extension, the Total visits calculations in P. It sounds messy and unnecessary (there may be more to be said about the hour sums, perhaps in a next installment).
And observe the manner in which the totals for Total Hours Open and Total Visits were realized, e.g.
=C21+E21+G21+I21+K21+M21+O21
Couldn’t all that alternate-column hoop-jumping, compelled by the summing of the hour totals for each day in row 21, have been bypassed with
=SUM(Q5:Q20) ?
I think so. And along similar if not identical lines this expression, in P21 of the Feb monthly aggregate sheet, for example:
=SUM(B21+D21+F21+H21+J21+L21+N21)
Could be written slightly more efficiently:
=B21+D21+F21+H21+J21+L21+N21
We haven’t completed this design survey, but in any event had the workbook’s organization been entrusted to me – and it surely wasn’t – I’d have committed all the data to but one data set, its fields looking something like this:

We’ve said this all before, but the above tack is the way to go, at least according to the experts. True, the data set would comprise about 6,000+ records – each week’s entries for each day for each of the 16 libraries enumerated – but if we’re starting from square one, the work is justified. Do it that way and in fact all of the findings we see before us in the Barnet sheet, and more – will be able to emerge all from one place, all from a series of pivot tables, or even just one.
On the other hand (again), these revisionisms of mine may be less than entirely fair. If the data as they stand in the Barnet workbook tell you everything you need, then sit back and enjoy a good read. But if you, the analyst, plan on learning something more than you’re already learning to date, then I’d put the pedal to Plan B.
Take it from a card-carrying Barnet library patron.

Leave a comment