If it’s legal it isn’t tax evasion. Play by the rules and then what you do is ruly; and that all-but-tautological bromide must be festooning the boardroom walls of multi, and singly, national corporations all over the marketplace.
The question about who pays how much tax is a rather large one, of course, and one efficient means of entrée to the question presents itself through the Australian government’s spreadsheet citations of the tax obligations of corporate entities that earned income in excess of $100,000,000 (those dollars are Australian, one assumes) in the 2013-14 fiscal year. And one can’t help but notice that for about 35% of these heavy hitters, the tax obligation amounts to zero (see the Guardian’s link to the data, and download the actual sheet here.
Of course the workbook can’t by itself derive the rights and wrongs about entities that pay more, less, or no tax (and six did owe more than a billion dollars, if that makes you feel better), but the data can point us to some auxiliary questions about the numbers just the same, provided we pay some attention to what needs to be done with them. (For more on the larger meaning of the numbers and possible accountings for the zero-payers, click on the link in cell A8 in the workbook’s Information tab.)
I’m thinking first of all about the blank cells that, in virtue of their vacant spaces, mean to report either no taxable income or no tax to be paid. Try to pivot table and group these unattended locations, though, and they’ll direct an unlovely (blank)-notated cell to your results; and while blank tiles may be a useful find if you’re playing Scrabble, they need to be exchanged here for something more substantive. The simple workaround: just select D3:E1541 and run a Find and Replace, finding nothing (that is, leave find blank) and replacing these with 0. (Note that you could have, under standard circumstances, have fearlessly selected all of columns D and E, because Find and Replace simply wouldn’t have bothered with the million or so wholly data-devoid rows idling beneath the records. But because two smaller, subsidiary data sets sit below row 1541 they’d have received the zeros as well, fusing them contiguously to the larger set. And that would incorporate them inadmissibly into any pivot table ).
Now of course if your one and only concern is to count the taxless entities without taking additional pains to contextualize that result, you could leave the zeros behind and simply write
=COUNTIF(E3:E1541,””)
That’ll deliver 579, or 37.6% of the 1539 enumerated firms. But if context is your game and you want to juxtapose those numbers to the remainder of the data set, you’ll want those zeros in there.
But if the zeros may be necessary they probably won’t be sufficient. For example: say you want to calculate and/or group the no-tax entities by their average income in order to see how they compare with the other 1,000 corporations who paid taxes, or at least paid something. Try pivot tabling the data, e.g. starting with
Row Labels: Tax Payable $
And you’ve already met up with a problem, because if you group the Tax Payable figures the 0 will be absorbed by a wider grouping interval – and you want to isolate the zeros, to the decisive exclusion of the remaining entities. And here we stub our toes on one of the subtle shortcomings of pivot tables – their immovable insistence on grouping data in obstinately equal intervals.
But there’s a plan B of sorts – a formulaic assortment themed around AVERAGE that seems to do what we want to do.
It goes something like this: First, I’d range-name the income data in C3:C1541 inc, and dub the corresponding tax payment range in E3:E1541 tax. Then enter somewhere in an open cell area (I’m starting at I8 in the Data sheet) the following tax-payment intervals:
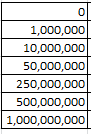
Of course a measure of capriciousness laces those thresholds, and you can refit them to your liking (you’ll just have to get all those zeros under control; remember, you’re dealing with hundreds of millions, and billions).
In any case we first want to return the average income of those entities that paid exactly nada in taxes. I’d try in J8 (the cell alongside the 0 interval marker):
=AVERAGEIF(tax,0,inc)
This sidekick to COUNTIF identifies in its three arguments a range bearing the IF criterion, the criterion itself, and the range to be averaged. Here, then, we’re looking at the average income of all entities paying 0 tax; and appropriately formatted I get
700,007,786.02
But because the next five thresholds patrol a band of values, i.e. we want to roll out the average income of those firms having earned between 1,000,000 and 10,000,000 – we have two formulaic options at hand. One, AVERAGEIFS, the souped-up model of AVERAGEIF, drums up an average on the basis of multiple criteria. It works, of course, but exposes its downside of a relatively convoluted syntax (look it up and try it if you doubt me). The second possibility, an array formula, is actually easier to write. In J9, for example, I can enter
{=AVERAGE(IF(tax>=I9,IF(tax<=I10,inc)))}
And again, this being an array formula, the standard concluding tap of Enter must be replaced here by Ctrl-Shift-Enter. The formula identifies, via a pair of nested IF criteria, the outer bounds of the band of income criteria. The “inc” argument earmarks the range of values to be averaged, provided they meet the two criteria (note that, so far as I know, the IF(AND…) phrasing that works for so many multi-criteria non-array formulas doesn’t seem to fly here – hence the reversion to the nested iFs instead).
The above formula can be copied from J9 through J13, that is, down the range whose averaging requires two “between” criteria. The final calculation, however, performed in J14 can be worked one of two sparer ways – it’s your choice:
=AVERAGEIF(tax,”>=”&I14,inc)
{=AVERAGE(IF(tax>=I14,inc))}
The former, the mainstream AVERAGEIF option, demands a criterion submitted in string- concatenated terms, in virtue of its equal-to-or-greater-than condition (you’d need to write such a criterion the same way in COUNTIF, by the way). The second, array alternative enforces no such stricture, however; its equal-to-or-greater than condition is written straightforwardly, but again conclude the process must culminate in that Ctrl-Shift-Enter.
Either way, after it’s all been run past the folks in quality control I get
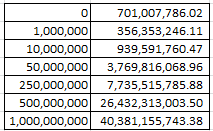
We see, then, that entities that paid no tax in in 2013-14 averaged substantially higher earnings than those that earned somewhere between 1 and 10,000,000 dollars, though the payments advance upward in a straighter line after that across the upper thresholds.
Ok, I’m not sure what that means yet; but I’ll let you take it from here.

Leave a comment