What goes up must go up, and for you basement dwellers (I’ve been there), what goes up sometimes goes down, too. For New York, the city of the majestic area-chart of a skyline, going up comes with the territory- marked out in part by the Open Data New York spreadsheet of Department of Building (DOB) data permits issued from the middle of July 2015 through the end of last year, and issued in turn to all here. (As per previous New York open data offerings, click the blue Export button, and follow with a click on CSV for Excel. Note that because the sheet is recurrently updated, your download will sprinkle some 2016 permit data as well into your mix).
It’s a big file, about 28.5 MB big, though we’ve seen them far bigger. In any case, though, my minimalist demiurge impels me to flap my scissors at any field that’s likely not to contribute to the analytical fray, starting with the extraordinary Oil Gas field in column W, which appears to consist of exactly one record – its header. But run a
=COUNTA(W1: W93814)
at the field and it reports back with a 93814, a bewilderingly insensible tally until you click any cell in W and click in turn in the Formula Bar:
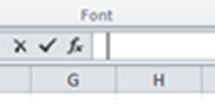
That cursor is flickering one space too far to the right – and that means there’s some there there, according to my reckoning 93813 cells worth of a single tap of the space bar, give or take the 150 or so that seem to have tapped out two or three spaces. I’m not sure what happened here, but we don’t need to know. Our next move is less ambiguous – just delete the column.
But there’s more. Precisely the same data eccentricity seems to beset AH through AJ (that’s their original columnar positions prior to the deletion of W); their cells seem in nearly every case to comprise nothing but free-standing spaces, and as such these too could be safely deleted.
There’s little doubt that all of these abandoned cells once contained meaningful data, but for some reason presently unavailable to you and me they’ve been swept clean by some well-meaning individual or gnarled branch poking out from some decision tree. In any case, I’d also make short work of the DOBRunDate field anchoring the data set’s final column; one assumes this chronology simply time-stamps the permit’s entry into the set. You could also probably tear out the next-door Owner’s House Zip Code and Phone # fields, unless you have a project of your own you’d like to discuss with one of them.
I’m also moved to do something about the Residential field, whose YES affirmations stand alone. Any disposition other than YES is simply met by a blank cell in the field, and if we entitle ourselves to the surmise that the blanks mean a reciprocal NO, then a Find and Replace to that effect should be conducted.
(Note, by the way, that if you wiggle your mouse over the i accompanying each field header on the Open Data site’s page you’ll receive clarification about that field’s data codes.
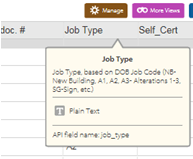
And if you don’t see the i right away, wiggle your mouse over the header some more. Thanks to Karin Hellman for enlightening me.)
But there’s a deeper attribute of the data that’s angling for our attention. A look inside the Bin # number field uncovers a myriad of duplicates (Bin, by the way, stands for Building Identification Number). And that plurality appears to signify different phases of construction or types of work performed on the same property. The problem, then, is to decide how these data might be counted. One could, to be sure, commence a pivot table with this initiative:
Row Labels: Bin #
After which each Bin would surely be identified but once, befitting its placement in Row Labels. But substitute Borough for Bin #:
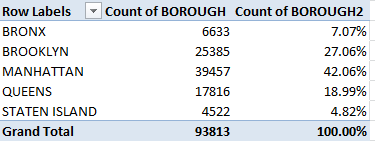
Row Labels: BOROUGH
Values: BOROUGH (Count, of necessity; the data are textual)
BOROUGH (again, here by % of Column total)
And you get:
(Of course you’d probably want to retitle the headings.)
And here’s the problem: what we learn from the above distribution is the number of permits the city issued across the mid-July end-of-year interim, not the number of distinct properties on which work was, or continues to be, done. Now while that finding may possess a utility all its own, it seems to me that a more instructive survey of permit activity would consist of a counting of the discrete properties requesting permits to proceed – and if you’re convinced by that prescription (and even if you aren’t), you then need to confine each bin number to a single incidence among the data, via the Remove Duplicates feature:
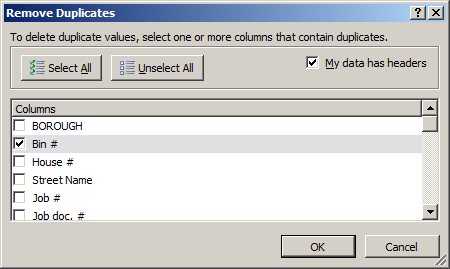
Take that step and you’re left with a precipitate of 32,383 unique Bin #s (again, your downloaded data set may have a few more records than mine. For a well-known array formula for counting unique entries in a range look here, for example). And that means that the number of actual properties for which permits were issued is a good deal fewer than we might have supposed. Of course, even 32,383 issuances stack up to about 200 different properties a day. It is New York, after all.
Now reproduce the BOROUGH distribution pivot table we see above with these unique Bin # identifiers:
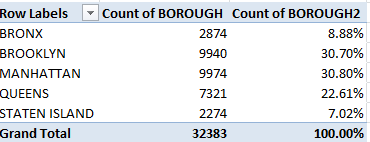
We see that the intra-borough proportions have shifted strikingly. Here Brooklyn realizes virtual permit parity with Manhattan, even as the latter borough piles far more permits onto the DOB desks. Perhaps Manhattan’s non-residential building activity and those structures’ more various inspectional demands steps up the bureaucratic attentions.
Indeed – pull out that second BOROUGH set of values above and roll in the Residential field, complete with its emended NOs, into the Column Labels area, and:
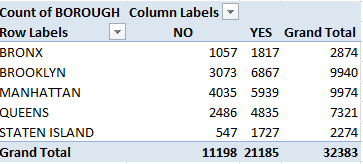
Viewed in % of Row Total terms (and again you don’t want or need Grand Totals here that ineluctably return 100%):
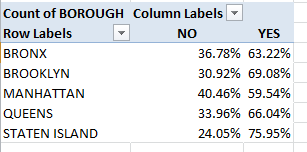
We see Manhattan’s notable edge in the NO – that is, non-residential – permit seekers.
But it’s quitting time; now you can take off your hard hat.

Hi Abbot,
I don’t know if the DOB got back to you already, but regarding the Job Type and Work Type and their unexplained notations, you can actually see the explanations of the values in the dataset online https://nycopendata.socrata.com/d/ipu4-2q9a if you hover on the little “i” icon on the column headers. Like shown in this screenshot: https://www.dropbox.com/s/1et4tthmlxelpcu/Screenshot%202016-01-07%2009.57.48.png?dl=0
That piece of explanation should really be part of the metadata as you download the data one would think.
Anyhow, enjoyed reading the post, hope this helped.