The real-time, tweet-borne reportage filed by New York Times’ reporter Lucas Petersen on his ride on a Megabus that went aflame somewhere between Chicago and Milwaukee got me to thinking about bus incidents in general, and the data that might impart a quantified perspective on such events.
In an interview after the fact Petersen allowed that he couldn’t find terribly much information on the matter, and truth to be told neither could I – with the conspicuous exception of London’s Transport for London site, which makes a series of quarterly-compiled spreadsheets on bus accidents in its jurisdiction available. After copying-and-pasting the most detailed dataset from each of last year’s quarters into a solitary, all-year sheet and custom sorting the records by Date of Incident and then by Route and Operator, I’ve stored it here:
With 5715 injuries, or more than 15 per day – 14 of which were fatal – the numbers are substantial, though of course I don’t know how they compare with those of other systems.
Turning to the data, note the set’s slightly ambiguous tile, recording incidents “…which required hospital attendance and treated on scene…” I would assume that “and” meant “or”, in view of the “Injuries treated on scene” item featuring in the Injury Result Description field and the attending explanation thereof posted in the Introduction tab.
But there are larger analytical concerns, apart from your interest in autofitting the columns and wondering why the text in the Injury Result Description field is variably sized. Note that the data on each accident victim receive a record all their own, they should. But at the same that necessary individuation drills the data down too far, de-coupling injuries which may have been incurred in the same accident – something an investigator might very well want to learn. For example, it’s entirely possible – even probable – that the two injuries detailed in rows 14 and 15, on route 11 in the borough of Westminster, were sustained in the same incident. But that surmise, however plausible, should not have been entrusted to any third party; had an incident ID been assigned to each incident instead, all ambiguity would have been allayed, enabling an accurate incident, in addition to injury, count as well.
On the other hand all the dates populating the Date of Incident appear in effect to have been rounded to the first of every reporting month, thus grouping the data there with undue coarseness. I would assume that actual incident dates are available somewhere, and I’m not sure why these would have been denied from the source worksheets. A correlation of incident counts by day of week would afford a standard, but instructive, chronology-driven finding; but it isn’t available here.
We could also ask about the very substantial number – about 32% – of victims whose sex is unidentified. One would have thought that so prominent and relatively unambiguous an attribute would have found its way into nearly every record, and I can’t explain why in, nearly a third of the cases, it didn’t.
Moreover the Victims Age field offers categorical, not numeric, entries, and again I’m not sure why. Apparently no accident site protocol here insists that investigators develop such information, though attending hospitals almost surely would have it.
In any case, and shortcomings granted, some simple but useful pivot tables are there to be set, e.g.
Row Labels: Victims Age
Values: Victims Age (% of Column Total)
I get:
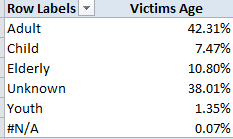
Speaking ideally, the considerable Unknown population would need to be (somehow) plumbed for any skew that would demand that we not ignore it. Put otherwise, if it could be demonstrated that the demographics of the Unknowns emulate those of the knowns we would be able to subject them to a measure of disregard. But by definition, we can’t.
We could also try this:
Row Labels: Victim Casualty Category
Values: Victim Casualty Category (% of Column Total; and you don’t need a Grand Total)
I get:
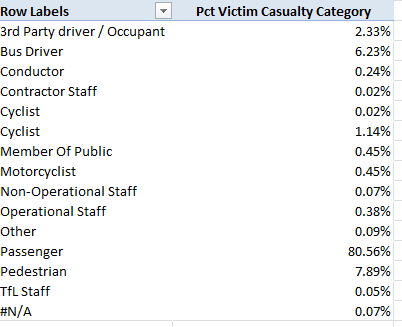
(Note the rewritten Values title. Remember you can simply type in the Labels areas.)
You’ve noted the apparently redundant “Cyclist”; but again, Row Labels enumerate their items uniquely. In fact, the more populous of the two Cyclist entries is trailed by a superfluous space. The simple remedy, again: Run a find and replace down the Victim Casualty Category field, finding Cyclist[space] and replacing with Cyclist.
We see the great bulk of victims are passengers, their predominance prompting a corollary concern with victim category and Incident Event Type. Drag that field into Column Labels and:
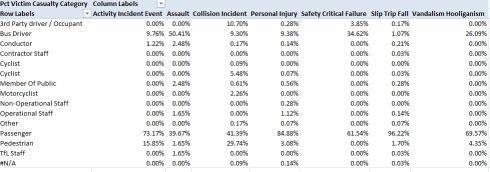
No, I don’t know how either Activity Incident Event or Safety Critical Failure are defined, but passengers account for 96.22% of all slips/trips/falls – presumably in the course of getting on or off a bus, though anyone who’s ridden the London system knows that its double-deckers can lurch and bolt like bucking broncos in mid-journey, too. Pedestrians – 7.89% of all victims – account for 29.74% of collision victims, a not particularly surprising fraction. Nor, one supposes, is the 61 of 121 assaults directed at drivers, whose aggregate injury percentage stands at only 6.23%.
And for another simple metric we could break out incidents by London borough:
Row Labels: Borough
Values: Borough (again, % of Column Total)
In excerpt I get:
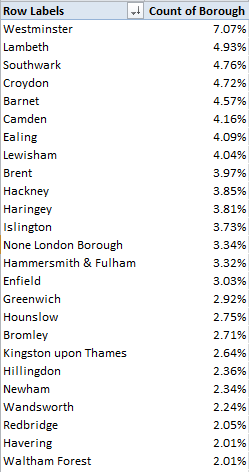
Westminster’s clear accident margin suggests, but only suggests, that the teeming borough simply supports more bus routes, but pull Victim Casualty Category into Column Labels and you’ll also learn that 10.42% of all pedestrian injuries were Westminster-sited, suggesting in turn that the foot traffic there is profuse (and again, I’m not sure about the None London Borough item).
All of which conduces toward this recommendation – watch where you’re going – on and off the bus.

Leave a comment