The broadened availability of data is potently arming the multi-theater war on drug abuse in America. Open-data concern Socrata – the firm whose interface front-ends a great many US governmental open data sites – describes its role the opioid epidemic here, for example. And the data.gov site has called up the sobering Accidental Drug Related Deaths 2012-2015 site from data.ct.gov, the Connecticut open data venue. You can download it here. Click the CSV link for Accident Drug Related Deaths 2012-2015.
Without substantiating the accidental, as opposed to the willed, character of the fatalities (that information is presumably sourced elsewhere), the Connecticut workbook details instances of lethal overdosing in the state for precisely four years, January 1, 2012 to December 31, 2015; and once some basic spreadsheet rough spots are smoothed, the data have much to reveal.
First, of course, the Date field need be auto-fit, as do a few other columns. Second, I cannot explain the intermittency of the CT references in the Death State field; on the other hand, since all the data emanate from Connecticut in any event the field can be overlooked or deleted.
But a somewhat more provocative complication besets the CaseNumber field in column A. It is clear that the cells’ two-digit prefixes insinuate the incident year; but because the final four digits of some of the entries – e.g. the one A3 – happen to resemble standard year references they are treated as such (particularly for 2012 incidents), as per one of Excel’s standard date formats. Had the field been prospectively formatted into text mode the ambiguity would have been forestalled; but faced with a mixed-format fait accompli the journalist will need to decide first of all if the field will make an analytical difference, and it probably won’t. Reliable and usable date data feature alongside the problem codes in column B, after all; but if you do insist on some unity of appearances in A perhaps the simplest tack would be to select column A, format the field in Short Date terms, and left-align the entries; thus the actual date in A3 will now read 12/1/1989 – still a date, but one that seems more-or-less of a piece with the other, labelled codes, which of course remain impervious to the new format. They’re labels.
You’ll also want to look closely at the Residence Field. The city name Waterbruy in F133 is almost surely Waterbury, and so needs to be emended; go ahead and run all the names through this single-field pivot table:
Row Labels: Residence City
And you’ll find No Haven, likely a truncated North Haven, and other suspect localities: Port Chester and Portchester, Stafford Spgs and Stafford Springs, West Haven and West Haven (the former revealing two interpolated spaces), and possibly a few others. If it’s your intention to break out the data by Residence City, then, these discrepancies must be researched, and repaired if necessary.
With that caution in mind we can nevertheless proceed to some meaningful pivot tabling, beginning with perhaps the most obvious:
Row Labels: Date (group by Year, if necessary; remember that the 2016 version of Excel will execute that grouping automatically, though you’ll need to filter out the <1/1/2012 and >12/31/2016 lines if necessary):
Values: Date (Count)
Date (again, by Show Values as % of Column Total).
I get

The overdose toll is grimly ascendant, with the 2015 totals more than doubling the 2012 figure.
Ethnicity, here identified as Race, would likewise compel the investigator:
Row Labels: Race
Values: Race (Count)
Race (again, % of Column Total)
I get:

If nothing else, the figures commit instructive violence to “minority” stereotypes about heavy drug use. As per the 2010 census Connecticut’s African-American population stood at 10.34%, even as overdose deaths across the four-year period among that group register 7.30%. And while estimates for 2012 put the state’s Hispanic/Latino representation at 14.2%, the merged 10.64% thus falls well beneath that proportion.
Other, standard scrutinies are available as well, for example age, grouped here in five-year intervals:
Row Labels: Age (grouped by five years)
Values: Age (Count)
Age (again, by % of Column Total)
(note two records lack age data. These can be filtered from the table without impairing the grouping.)
I get
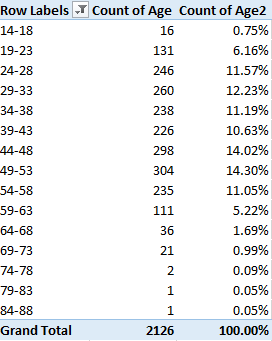
I was surprised by the 44-48 and 49-53 modal intervals, my having assumed that the overdoses would have clustered further down the age range. But that’s why look at data.
Gender by year might also prove informative:
Row Labels: Date (again grouped by year and appropriately filtered)
Column Labels: Sex (the two blanks can likewise be filtered)
Values: Sex (Count, as the data are textual)
I get:
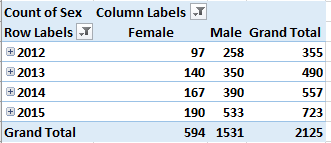
Refigure these as % of Row Total and withhold Grand Totals for rows:
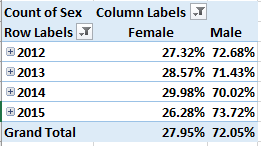
No striking inter-year gender differential obtains, though of course we see that overdose deaths befall an overwhelmingly male population.
For location of incident:
Row Labels: Location
Values: Location (Count)
Location (% of Column total)
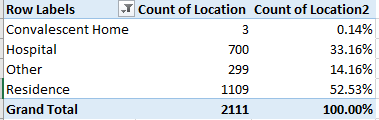
(Note the 17 blank records were filtered.)
As the dataset reports apparent accidental overdoses, the fact that over half of the deaths occurred in a residence, though not necessarily that of the victim, is unsurprising.
For a final consideration here – though plenty of other permutations are there across the data – it occurred to me that some relation between overdoses and day of the week might obtain. If that inquiry is redolent of a non sequitur, so be it – why would anyone impute a relation between the two, you may wonder? Still, I thought a look might be worth the taking. And it was.
Because the incident dates command column B, the standard means for developing the answer would be to head into the first free column abutting the data – column AF – and enter, starting in AF2:
=WEEKDAY(B2)
After replicating that formula down the column, you’d typically move to learn the distribution of overdose events by day via a series of COUNTIFs, or a pivot table tally; but a more parsimonious approach, one that would look past that column replete with 2100 WEEKDAY formulas, comprises seven array formulas instead.
Those formulas would ask you first to stream numbers 1 through 7 down a column – let’s say in cells AH5:AH11. I’d then write in AI5:
=SUM(IF(WEEKDAY(B$2:B$2129)=AH5,1,0))
And because the above is an array formula the entry process concludes with the storied Ctrl-Shift-Enter triumvirate. I’d then copy the formula down through AI11.
What the formula is doing is assessing each cell in the B2:B2129 range – the dates – for their weekday number (Sunday defaults to 1, and so on, through Saturday’s 7). The formulas then ascribe 1 to each cell whose weekday matches the neighboring entry in the AH column, and finally sums them. The routine yields these outcomes:
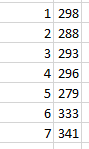
You’ll observe that the totals for days 6 and 7 – Saturday and Sunday – are notably higher than those for the other five days of the week. The finding then: that, for whatever reason, more lethal overdoses in Connecticut are perpetrated on the weekend. A consequence of heightened recreational drug on those days? It’s possible, but that conjecture needs to be researched.
But there’s a catch: add the totals above and they sum to 2128, or the number of records in the dataset. But two of the dates in the B column are in fact missing, and so the above array routine is somehow admitting the blank cells to its count. And why? It’s because the WEEKDAY function treats a blank cell‘s reference as a Sunday, and thus evaluates it as a 7. I’m not sure why – it may have something to do with how WEEKDAY divides a date’s numeric equivalent – but whatever the reason, that’s what does. As a result, the weekday counts above errantly ascribe two Sundays to the tally that aren’t there.
It took me a while to realize a workaround, but I came up with this, entered in AI5 (again concluding with Ctrl-Shift-Enter):
=SUM(IF(LEN(B$2:B$2129)>0,IF(WEEKDAY(B$2:B$2129)=AH5,1),0))
It looks a bit fearsome, but what’s happening is that the formula determines if the entry in B exhibits a character length greater than 0 – that is, it asks in effect if the cell is blank, by looking for non-blanks. If that logical test is passed, then the array formula proceeds per its original remit. The effect, then, is to exclude the blank cells, delivering a total of 339 Sundays. But the weekend effect remains in force.

Leave a comment