Anyone with an investigative concern with terrorism – and that complement is regrettably large – would do well to point itself at the Global Terrorism Database (GTD), the self-described “most comprehensive unclassified data base on terrorist events in the world” tended by the University of Maryland’s National Consortium for the Study of Terrorism and Responses to Terrorism, or START. Dating from 1970 and comprising over 156,000 records of incidents world-wide, the database in spreadsheet form is available to interested parties for download, provided the requestor complete a simple requisition form.
The database, then, is vast (75MB) and instructive, though you’ll need to read the very real qualifying cautions in the GTD FAQ page, particularly accountings of the missing data for 1993, shifts in incident counting methodologies beginning in 1998, and the Database’s definitions of terrorism. You’ll also probably need to download the GTD Codebook for a resume of the database’s 111 fields.
But while not faultless, you’ll want to consult this resource, even as some questions about its spreadsheet incarnation remain to be asked as you work with its holdings. For example, note the zeros in the imonth and iday fields (columns C and D) that proxy for unknown incident months and days. However only 23 month cells here go answer to the “unknown” description, while a more measurable 894 days are currently lost to the compilers. These relatively small lacunae will necessarily impinge event breakouts by chronology, of course, but again, their compromising effect is small, calculating to about .6% of all records.
Less clear are the entries informing the approxdate field in E; the codebook (page 12) allows that approxdate archives those incident dates whose ascertainment is unclear, but in most of the approxdate cases the same information already populates the contiguous iyear, imonth, and iday fields. Moreover, the approxdate data are textual, and as such aren’t immediately ready for analytic use with some formulaic backs and forths.
I’m also not sure what the country and region codes in H and J respectively bring to the data, in view of the actual country and region names that sidle these fields. But that’s a quibble; if the fields prove unneeded they can simply be ignored, after all.
But once you’ve oriented yourself to the database-cum-workbook, some obvious but most interesting pivot tables beg our consideration, for example, terrorist incidents by country and year:
Row: country_txt
Columns: iyear
Values: iyear (Count, Show Values as % of Row Total)
(For presentation’s sake you may want to beat back the fusillade of zeros invading the above table cells. Try File > Options > and click off the “Show a zero in cells that have zero value” box beneath the Display options for this workbook heading.)
Now if you bring a 2016 sensibility to the data you’ll be surprised, at least some of the time. Terrorist acts in the United States peaked in 1970, with 17.38% of all acts – 468 in absolute numeric terms – across the 46-year span ending in 2015 having been perpetrated in that year. Double-click that 17.38% and a new table springs from that figure, and onto a new sheet. Pivot table those 1970-specific data:
Rows: provstate (bears US state names)
Values: provstate (Count)
And you discover that 98 terrorist acts – as defined here – were incurred by California, with another 86 having been inflicted in New York. Substitute gname (g for group, presumably, in column BG) for provstate in Rows and find 108 acts mounted by generic Left-Wing Militants, 69 undertaken by what the GTD calls Black Nationalists, 54 wrought by Student Radicals, and so on. Compare that outpouring with the grand total of 38 incidents tracked in the US last year – that sum lifting a curve that has pulled upward since 2011, to be sure, but certainly far flatter than the Vietnam-era total registered 46 years ago (the implication, then, by the way, is that the immediately pre-1970 counts were perhaps comparably numerous, but the GTD doesn’t have those data. On the other hand, 1970 seems to stand as a towering apex among the years, even the ones that immediately follow it).
Subjected to a simple pivot table line chart, enabled by referring the country_txt field to a Slicer within which one can isolate one country at a time, and stationing iyear in Rows, the American (United States) incident totals read thusly (recall the missing 1993 data, though):

The charts for some other countries not unacquainted with terrorist attacks:
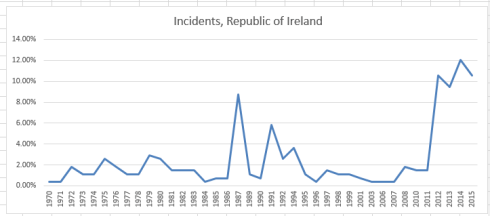
There I would have supposed the spikes would have bolted upwards earlier, during the throes of the Troubles.

Again, I would have surmised an earlier peak, but note the welcome trough in acts in 2015.

More expectable, perhaps, though note the 1975 year-inception point and the remarkably sparse incident count through 2003.
Note at the same time, however, that the charts reckon percentage distributions of incidents, and don’t size up absolute incident counts for the countries. Those read as follows:
US – 2693
Ireland – 274
Israel – 2085
Iraq – 18770
Iraq’s enormous total is thus very much a recent vintage.
Of course any surprise at any of the charted histories above may have more than a little to do with one’s definitional investments in the term terrorism. It may be easy not to liken the Weather Underground and its 45 attacks from 1970 through 1975 to the latter-day insurgencies of Al Qaeda (I854 attacks under variant names), but that aversion needs to be thought through, and the QTD did – though of course you’re welcome to contest and/or refine the understandings.
For a worldwide incident count, click the Clear Filter icon on the Slicer, in effect selecting all countries simultaneously:
The chart result:

10.74% of all the recorded attacks were conducted in 2014, with a small but appreciable decrement to 9.41% characterizing the following year. Still, an extraordinary 39.6% of all attacks crowded the six years spanning 2010 through 2015 (note that by imposing a five-year grouping interval on the iyear data, the pivot table nevertheless casts the most recent data into a six-year tranche, 2010-2015).
In any case, with 111 fields and in spite of its lengthy blocks of blank cells, the GTD’s massive trove of data has a lot of permutations in there.

Leave a comment