You can’t tell the players without a scorecard, they’ll tell you in the States, and you can’t tell the data without the formulas.
You’ve heard more memorable pronouncements than that opener, I’ll grant, but that less-than-bromidic avowal above makes sense. We saw in the last post how the Team USA height, weight, and birth state data threw more than a few curves at us, and baseball isn’t even an Olympic sport any more (it’s coming back in 2020, though); fail to straighten out the data curves and your analysis will be straitened.
Now that line’s a few sights more memorable, but I do go on. Our next round of data inspection takes us through the DOB (date of birth) field, and we want to get this one right, too. Quality control here starts by aiming a COUNT function at the rows J2:J559 that populate DOB. Since dates are numbers, and since COUNT only acknowledges a range’s duly numeric data, we should aspire here to a count of 558, or one date per cell. But my COUNT totals 520, a shortfall that exposes 38 dates manqué that, facades aside, are nothing but text.
Our COUNT is all the more incisive in view of the fact that every entry in the J column really does look like an unassailable date. But now that we’ve made ourselves aware of the turncoats among the loyal numerics, we’d do well, if possible, to rehabilitate them into the real things too. Here’s a pretty painless way: commandeer the next free column (it could be S, if you’ve left the formulas from last week’s exercises in R alone; if so, you’ll have to format S in Date terms), title it Birth Date, and enter, in row 2:
=IF(ISTEXT(J2),DATEVALUE(J2),J2)
And copy it down. The formula asks if the entry in J2 is textual. If it is, the DATEVALUE function – a rather useful transformative means for turning pure text such as 12/14/1989 – if that expression has been formatted into text – into 12/14/1989, the date version. If the entry in J is an authentic date, on the other hand, the formula simply invokes it its cell entry as is.
Surprise – my eminently sensible tip doesn’t always work. Copy the formula and you’ll be treated to nine #VALUE!-laden cells; a first review of these implicates an old nemesis – a superfluous space, in the source field e.g.:
DATEVALUE can’t handle that textual intrusion, and so this refinement:
=IF(ISTEXT(J4),DATEVALUE(TRIM(J4)),J4)
Looks right, because TRIM’s job is to make superfluous spaces unwelcome.
But that revision doesn’t work either. Puzzled but intrigued, I went for the next move: a copying of one of the problem entries in J into Word, wherein I turned on the Show/Hide feature (in Home > Paragraph) that uncovers normally unseen codes. I saw:

Look closely and you’ll detect that special character to the immediate left of Word’s paragraph symbol. That Lilliputian circle appears to signal a non-breaking space, and apart from any conjecture about what and why it’s doing there we know one thing: it isn’t a superfluous space, and thus won’t be trimmed.
Thus again, the fix here may be short on elegance but long on common sense: edit out the circle from the nine problem entries in J (in fact some of the cells require two taps of Backspace in order to rid them of their codes. If you sort the dates by Largest to Smallest by first clicking on an actual date all the #VALUE! errors will cluster at the bottom).
And that works, leaving us with yet one last irritation – the birth date of Shooting team member Daniel Lowe, which reads
11/181992
No need to get fancy here – just enter that slash.
Now, I think, you can go about your analytical business, e.g., breaking out athletes by birth month. You may recall my consideration, in a piece on 2012 Olympic data, of the alleged August effect, in which American athlete births in that month appeared to significantly depart from a chance prediction. Let’s see what the current team data tell us, via a pivot table:
Rows: Birth Date (grouped by Month)
Values: Birth Date (Count)
Birth Date (again, by % of Column Total)
(We don’t need Grand Totals here). I get:
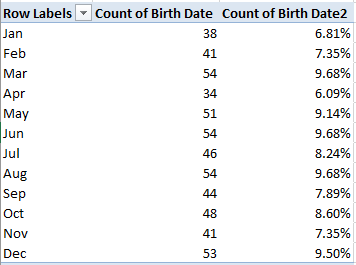
Here August – generally the most fecund month in the United States – shares the modal figure with June and March, its proportion substantially smaller than August’s 2012-team contribution. The numbers here simply suggest no special birth skew impacting the US complement, at least for this Olympics.
We now can also calculate each athlete’s age in conjunction with the most able assistance of the nifty and unsung YEARFRAC function. Enter the Olympics’ start date – August 5, 2016 – in any available cell, name the cell start, and proceed to column T, or whichever’s next available on your sheet. Name it Age and in row 2 try (assuming the corrected dates lie in the R column):
=YEARFRAC(R2,start)
YEAR calculates the distance in years between the two dates on either side of its comma. Thus, cell-reference four-gold-medalist Katie Ledecky’s birthday – March 17, 1997 – in YEARFRAC, and with the start date cell holding down the second argument you get 19.38, Ledecky’s age in years on day one of the Olympics (note that can’t actually enter 3/17/1997 in the function, because YEARFRAC will treat the entry as text. You need to either reference the cell bearing that date or enter 35506, the date’s native numeric equivalence).
Copy down the column and this pivot table beckons:
Rows: Sport
But guess what…
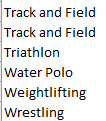
Yep, it’s that superfluous space thing again, this time practicing its mischief on four records among the Track and Field data. The simplest repair in this case, as it turns out: select the Sport field and run a Find and Replace at the column, finding Track and Field[space] and replacing it with Track and Field. That works, because in this case each of the errant four have incurred one space.
Now introduce the Age field to Values (Average, formatted to two decimals). Bring back Age a second time, now exhibiting Count sans decimals. If you sort the results Largest to Smallest you’ll see the 12-member equestrian team holding down the age-senior position, with Team US’s eight boxers computing to a lowest-age 20.75.
We could also correlate average athlete weight by event, an association which might drum up some less-than-obvious numbers, e.g.
Rows: Sport
Columns: Gender
Value: Weight (Average, formatted to two decimals)
I get:
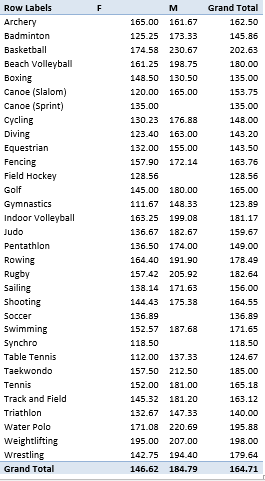
Of course the per-team numbers are small, but they make for interesting reading, particularly the respective by-sport gender disparities (and note some absent teams among the men’s delegation).
I was surprised by the greater average weights of the two basketball teams measured against their rugby colleagues, even if the latter is (officially) the contact sport. And I did a double-take when I caught up with the respective boxing team weights; women boxers outweigh their male teammates by an average of 18 pounds. But here we’ve been thrown a sampling curve – the six male pugilists are concentrated in the lower weight divisions, even as the women – comprising exactly two boxers – weigh 132 and 165 pounds.
Eek – there was a lot of hard work to do in there; I think I deserve a podium finish for this one.

Leave a comment