Read any good campaign financing reports lately? OK – it’s precisely that kind of question that explains why you cross the street when you see me coming your way.
Social skills aren’t my strong point, but I won’t be deterred. For those who want and need to know about who it is who’s paying for American’s presidential candidates this year – i.e., Clinton, Trump, and everyone else, past and present, click into the Federal Election Commission’s site and you’ve come to the right place. All kinds of spreadsheets in there aim to give the taxpayers their money’s worth, including a state-by-state drill-down of contributions, among which of course are the New York data. It’s a big state and a big sheet, so please download it via the above link and its ensuing NY.zip reference:
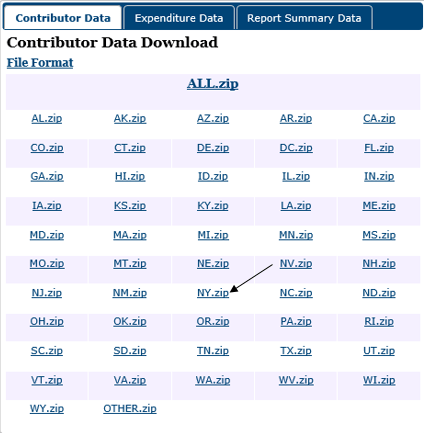
The sheet’s 391,513 records log candidate contributions harking back to October, 2013, taking the activity up to August 1 of this year (really July 31; the one August donation on the books notches a donation of $0, and I’m not sure what that entry means to tell us), a short while before both the major party conventions came and went. But 3,204 of these mark refunded (or redesignated) gifts whose figures are expressed as negative numbers, and which assumedly have to be squared with some equivalently positive sum. But before we slide that and other attention-begging data issues beneath the microscope rest assured that all the monetary sums in column J – contb_receipt_amt – and dates in K – contb_receipt_dt – are uniformly numeric. Cool – 783,026 cells you don’t have to worry about. And contbr_st in F is wholly ignorable; because the sheet as a matter of definition marks contributions issuing from New York, the NY entry is the only one you’ll find in the field. But you will have to auto-fit a number of the dataset’s columns, rather an expectable necessity.
Of course the data’s essential investigative question asks how much money each candidate has accumulated; and the answer should be straightforwardly realized, via a pivot table. But before the table happens something need be done about those 3,204 negative values. It seems to be me that their manner of disposition here could be argued about, but I hold that they should be simply ignored – because since they stand for actual contributions that, for whatever reason were recalled, e.g. a campaign shutdown (I’m assuming none of these were voided for reasons of impropriety), they should be accounted in the candidates’ sums. These were monies that were raised, after all.
Again, that position could be contested, but I’ll go with it for the time being; and if then I’m to ignore the negative contributions I can appropriate next-available-column S, call it Contribution, and enter in S2:
=IF(J2>0,J2,””)
We’re simply stipulating that if the actual contribution in the corresponding J cell exceeds zero, use it; otherwise, assign a double-quote result which neither be tallied by the COUNT function nor acknowledged at all by AVERAGE (it will be noted by COUNTA, however).
Copy the formula down S and then proceed:
Rows: cand_nm
Values: Contribution (Sum, formatted to two decimals and Use 1000 separator, or comma. Note the comma doesn’t punctuate the very 1000 alongside the checkbox.)
Contribution (again, here Show Values As > % of Column Total)
I get:
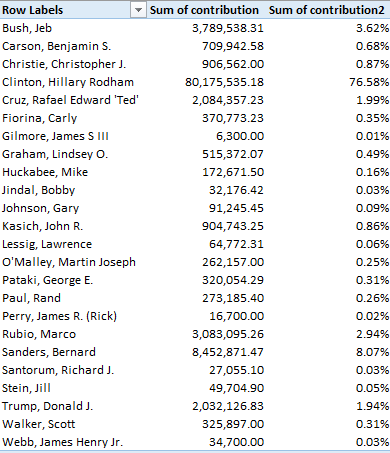
We see Hillary Clinton’s extraordinary sway over the New York donor cohort (and no, I haven’t heard of all those candidates), her receipts trumping the Donald’s 40 times over. Her margin over erstwhile rival Bernie Sanders is more than nine-fold, though of course the latter’s campaign exchanged the hat for the towel some time ago. What’s also nice about the data, as it were, is the steadfast uniqueness of the candidate names in Rows. It’s a pleasingly no-tweak list: no faux duplicates among the 24 aspirants, no alternate names, no misspellings.
Having gotten this far you may want to break the data out additionally by date, a determination that asks a presentational decision or two of us. First I’d whisk the second entry of contb_receipt_amt out of the table, because the data subdivisions about to be instituted by the date parameter would inflict something of a mess on two sets of side-by-side values.
Next we – or you – need to do something about date granularity. If you install contb_receipt_dt in Columns and group its data by Years and Months, 27 columns of numbers pull across your screen (in addition to Grand Totals), an unfolding that might or might not serve readability and/or your analytic designs terribly well. Group by Years and Quarters, on the other hand, and the table retracts to 10 columns. Note, though that the final item here – Qtr3 for 2016 – comprises but one month, July.
Whatever you decide, you won’t be able to miss Clinton’s recent lift-off in her bank account (and pitched to a smaller magnitude, that of Trump), as well as the reddening of the books of failed candidates, their negative numbers presumably signalling monies returned in the aftermath of campaign shut-downs.
You may also want to pursue a corollary interest in the numbers of and per-candidate average. Now that we’ve assumed our stance on the negative-number issue, we can pivot-table thusly:
Rows: cand_nm
Values: Contribution (Count, no decimals)
Contribution (again, by Average, two decimals, 1000 separator)
I get:
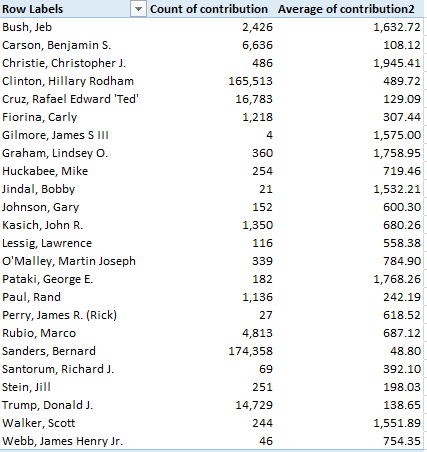
Some remarkable disclosures emerge. We see that contributions to the Sanders campaign actually outnumbered those of Clinton’s (as of July 31), but their average amounts to but one-tenth of the nominee’s per-donor outlay, a most interesting and meaningful bit of stratification.
But not so fast. If you sort the contributions you’ll find nine seven (or eight)-figure Clinton contributions described as Unitemized; presumably these mighty aggregates enfold a great many individual gifts, and have the effect of sky-rocketing Clinton’s apparent average. In fact, those nine total over $41,000,000 – more than half the Clinton total – and mincing these into their discrete donations would likely roll up a Clinton contributor count that would overwhelm the Sanders figure – and ruthlessly depress the Clinton per-gift average at the same time. There’s nothing in the worksheet, however, that can tell us more about those nine behemoths. Some deep background, please. Note Donald Trump’s low average, along with the 10,000+ contributions to all candidates amounting to precisely $2,700 each, an apparent obeisance to the maximum permissible contribution of an individual to a candidate’s committee.
All very interesting. But there’s more to be said about the New York – and the data aren’t always no-tweak.

Leave a comment