Just one, or perhaps 390,000, more things about the New York Presidential contribution data: might not the analysis be buoyed by a counting of monies apportioned by contributors’ occupations? It might; start with
Row: contbr_occupation
But stop there and you’ll already understand. Prepare to gaze upon 12,355 uniquely labelled vocation descriptions – but it isn’t their formidable heft that’s the rub. What’s adulterating the mix – again – is the manner(s) of inconsistencies among the labels, and how they impede the prospects for any follow-through across the data. What, for example, are we to do with these cognate employments:

Of course we’ve beheld this complication before, but the problem set here is perhaps slightly different. For one thing, the occupations have in all likely been furnished by the position holders themselves, and so we should properly withhold “blame” from the spreadsheet compiler. And with self-description comes classificatory idiosyncrasy, the bane of the grouping enterprise. Thus what editorial decisions are we to make about these kindred callings?

Does the analyst subject all of the above to a unifying, equivalent proxy occupation? There are 12,000 of those determinations to make here, and you’ll have to determine in turn if you have the time and/or money to devote to the challenge. The answer might be no.
In any event, if you’re enjoying the confusion and the complexity and want to go national, pop open the sheet detailing overall top fundraising periods in election years (it’s the very last Excel link on the page). The compendium, recording candidate receipts and contributions (the former is a superset of all monies including public funding, and hence are very often the greater sum. In 29 cases, however, contributions exceed receipts, often by a very small differential. See the notes on rows 3664-5) for presidential contests tracking back to 1980 and including the current tilt, comprises an assortment of parameters that seemed designed to inspire unease. Again, throw the Presidential Candidate field in a pivot table rows area and survey the ensuing list. How about

(Yes, the two are one and the same.)
Or more famously:

The point won’t be belaboured further (note, on the other hand, that the Bush, George and Bush, George W entries indeed signify father and son, and are meaningfully distinct).
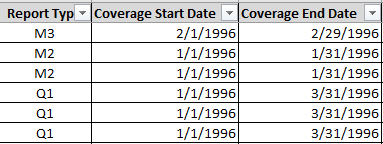
Then replace Presidential Candidate with Report Type:

First, I don’t know what all those markers mean – e.g. 10P and 12C. Second, you do know what the redundant M6, M7, and M8s mean – uninvited spaces that have to go (the M data’s less-than-fully-numerical sort order follows from the fact, of course that they aren’t numeric at all; the M demotes these to label status, and if you want M10-12 to
Note as well that the M, or month, items advance their chronological references by an increment of one. That is, M3 reports contributions for February, and M12 counts monies for November. December data, then, are anomalously assigned YE, which I take to denote year end – but in fact if you filter all the data set entries for the YE’s, numerous pre-December 1 Coverage Start Dates loom, along with some Coverage End Dates that pull into January. Anyone have the FEC phone number?
Third, I’m disquieted by the potential apples-and-oranges mishmash of monthly and quarterly contributions that spill across the entries. Turn to the data and autofilter the receipt data for say William Jefferson Clinton (you remember him). You’ll see in excerpt:
On the other hand, you’ll learn that the above receipts emanate from different Clinton election committees, and so if the quarterly and monthly numbers properly and strictly line up with different organizational entities – that is, the totals can be deemed mutually exclusive, and we’re likewise satisfied that we alleviated any name discrepancies – then we should at least be able to aggregate a candidate’s intake by year:
Rows: Report Year
Slicer: Presidential Candidate
Thus Hillary Clinton’s numbers read:
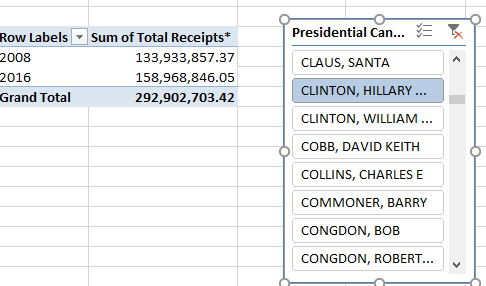
Remember of course the 2016 totals come to rest at August 31.
If you want to play safe, you could at least globally array receipts by election year:
Rows: Report Year
Values: Total Receipts
I get:
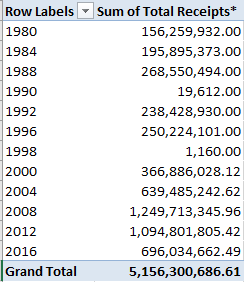
(It appears that all dates are authentically numeric, by the way.) Remember that the 2016 total tops at August 31 (really September 20 for one failed candidate, Lindsey Graham); thus with two-thirds of the compiled year having elapsed, the current total projects linearly to around 1.044 billion dollars, a small downsizing from the two previous presidential years; but it may be reasonable to suppose that a late-in-the-game contribution rush could hoist the final numbers above and beyond. The significant contraction of the 2012 sum from 2008’s aggregate warrants study, however. In any case that latter year seems to have incited a quantum leap in campaign inflow. And as for those small non-Presidential-year 1990 and 1998 totals, they were earmarked to hopefuls Willie Carter (something of a perennial candidate, apparently) and Frank Starr, respectively, and about them I know nothing more – nor am I certain about the reasons for those years’ inclusion. A sidebar awaits.
And if you were wondering, Santa Claus raised $180.00 in 2012.
—
And I’m on vacation now; I just can’t find Word Press’ out-of-office reply.

Leave a comment