We could precede any look at the birth-month data for women tennis players with a couple of variously obvious questions. The first asks, most evidently, how these data will compare with those of the men’s cohort. The second asks about those very suspicions; that is, why we’d bother to promote the sense that the women’s results might depart from the men’s. Why should they?
But we can’t begin to suspect without seeing the data, and those offer themselves up to us on the Women’s Tennis Association site here; but I’ve prepared a neat pre-packaged version here:
Those 1300 or so rankings (1313 in fact, that less-than-round number presumably reflective of equally-ranked players) come complete with player country of origin and (real) birth dates, just what we need (note however, that the player names have been freighted with a superfluous space that you’ll need to trim should you work with those data).
But I digress. Why, after all, might the women’s birth months vary from the men’s? A popular surmise maintains that women players are typically the younger, a nugget of popular wisdom worth mining, as it turns out; ranked women exhibit an average age of 22.52, while the men figure to 24.27. But a birth-month gender divergence thesis would leave popular wisdom out in the cold.
So let’s see. Paralleling the men’s inquiry, we could pivot table the women’s data thusly, for starters:
Rows: DOB
Values: DOB (Count, then % of Running Total against the DOB baseline). Turn Grand Totals off.
I get:

Again, a first-half-of the-year imbalance emerges, albeit somewhat less pronouncedly than the men’s 55.90%. If we pitch Rankings into the Columns area and group these by bins of 100, we get in excerpt:
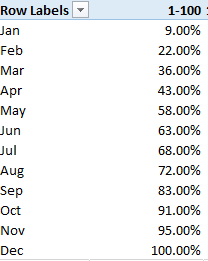
Here the first-half predominance is striking, though again the universe’s 100 cases might throw up some interpretive cautions. If, per the men’s survey, we next group the rankings by tranches of 500:

(Remember, and unlike the men’s rankings, the women’s data comprise only 1313 players; and as such the 1001-1500 bin contains 312 records). We see a slow increment in first-half percentages across this coarser grouping, but the edge holds in each case.
For the American contingent, a country Slicer can again be put to work, to recreate last week’s result here for women:
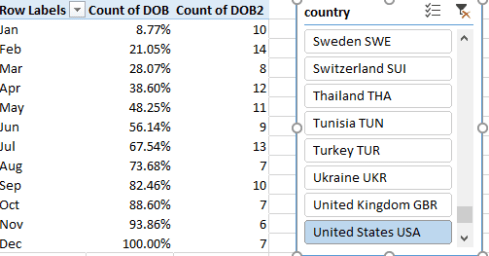
Unlike the men, a US first-half effect does registers for the 114 women from the States.
I’m not sure what, if anything, that means – particularly given the modal birth month for the American women of February – but we’re left to consider the import of the larger findings (while remembering of course that the first half of any year comprises fewer days, too); and again, the notable persistence of the first-half birth-month margin sets its explanatory challenge before us, and toughened by the data’s cosmopolitan demographics. 84 countries have provided the ranked women, and that variety doubtless bespeaks diverse recruitment and instructional programs, all aggregating to the above distributions. And the rough likeness of the men’s and women’s birth-month distributions may simply affirm a gender-invariant character to those programs these days. In any case, if you’ve been looking for some journalistic marching orders, perhaps you’ve found them here.
Now it was during these speculations that another means for assaying the birth-month phenomena came to mind. Instead of breaking out births by months – a wholly sensible recourse, to be sure – it occurred to me that a birth-month index of sorts could be developed by determining the percentage of days of any particular birth year elapsing from January 1 of a baseline year, divided into a player’s actual birth date. Thus, a player born around July 1 – more-or-less the year’s halfway point (there are leap years in the chronology, of course) – would exhibit a birth fraction, as it were, of .5.
The idea in turn would be to average all the players’ birth fractions, with the intention of learning how near or far from .5 the average might veer. A relatively low average – e.g. .45 – would signal a cohort average birth date prior to July 1, and thus offer another, finer reading of the birth-month data. By way of contrast, if one breaks outs births by month – as we have to date – then births on June 1 and June 30 are to be understood as equivalently June-occurring – even as the former date holder is of course older.
With that program in mind I can move into column H, title it YearPercentage are something like it, and enter in H2:
=(DAYS(E3,DATE(YEAR(E3),1,1))+1)/IF(MOD(YEAR(E3),4)=0,366,365)
Then of course you’ll copy down the H column.
(Your formula labors here and elsewhere may profit by subjecting them to a durable, onscreen look in a free cell, by referencing the formula with the FORMULATEXT function.)
What is this formula doing? Something like this: it calculates the number of days a player’s birth date is distanced from January 1 of her birth year, and divides that number by the number of days appropriate to that year. In the case of the highest-ranked Angelique Kerber, born on January 18 (remember to send her a card) – the 18th day of the year: if we divide 18 by 366, (the day count of the leap year 1988), we get .049, the proportion of the elapsed year.
So let’s try to detail the workings of the formula. The DAYS function counts the number of days spanning two dates, beginning here with E3, or Kerber’s birthday. The DATE(YEAR(E3),1,1))+1 segment returns January 1, 1988, by grabbing the year from E3, and then posting 1 and 1, or the first day of the first month. Equipped with those three identifying bits, DATE then realizes the specified date, with the +1 tacked on to see to it that, for example, a January 1 birth date returns a 1, and not a 0.
Kerber’s numerator, then, should read 18, a figure divided in turn by either 365 or 366, the two possible year day counts. The formula asks, with the intercession of the MOD function that appraises the remainder of a number divided by the second argument – in this case 4 – if the year drawn from E3 is precisely divisible by that 4. If it is – that is, if the formula discovers a leap year – we use 366; otherwise, the formula supplies a denominator of 365.
Once you copy the expression down the H column you can simply enter a standard AVERAGE somewhere:
=AVERAGE(H3:H1315)
I get .4732, suggesting a player birth-month “average” appreciably in advance of the June 30/July 1 yearly midpoint.
And while of course that result appears to merely corroborate that which we already divulged through the earlier pivot tables, our finding here is advantaged by a greater precision.
And precision, as any player whose serve bounces a half-inch outside the lines will tell you, matters.

Leave a comment