Looking for a sure-fire ice-breaker to rustle that awkward silence? Try asking this one: how many airports roll their runways out for flyers worldwide?
I mean, if that question doesn’t electrify your partner into a conversational frenzy then…well I do go on.
Anyway, the answer as of this writing, is 50,863. That’s a pretty big number, gushing over and above a Quora’s respondent’s count of 43,983, tallied in 2016. My source, David Megginson’s Ottowa-based ourairports site, reports the larger figure, and had actually added 20 airports to the count by the time I accessed the data anew (the airports.csv workbook), and after my having performed the analyses below. By the time you get to the site, who knows?.
The data for the most part seem ready to go, and as such are answerable to a number of standard but useful questions, starting with a pivot-tabled distribution of the types of airports:
Rows: Type
Values: Type
Type (again, % of Column Totals)
I get:

We see that nearly 65% of all airports qualify as small, the sorts at which you’ve likely not disembarked (I’ve discovered a definition of “small” minted by the United States’ Federal Aviation Administration, denoting a facility receiving .05% and .25% of the nation’s boardings, but of course that understanding is US-specific). You also probably haven’t touched down at one of the 20 world’s balloonports, 17 of which get airplay in the US. And I for one am slightly surprised by the substantial representation of heliports in the census. But copters, remember, started hovering long before your mouse did.
You’ve also doubtless duly recorded the count of closed airports, begging the analytical/presentational question whether that not-insubstantial cohort should be tolerated by the dataset, or otherwise grounded. By running a standard data filter on the set, filtering both for “closed” and “CA” in ISO_country, it can be seen that 629, or more than a quarter, of shuttered airports are based in Canada. Whether that figure perpetrates a recording bias by the workbook’s Canadian authorship I don’t know, though I suspect something else is at work here. I suppose that’s where you come in. (ISO country codes are issued by the International Organization for Standardization, and are set forth here.) My inclination is to remove these dormant locales, but only impermanently, via the storied fall-back: run a Find and Replace at “closed” in the C column, replacing every such instance with ZZ, sorting C by A to Z, and threading a blank row between 48541 and 48542, thus ruling the erstwhile closed entries out of the data, but keeping then on call for retrieval if you need them.
We could then break out airport totals by country, for starters:
Rows: ISO_Country
Values: ISO_Country (sorted largest to smallest)
ISO_Country (again, % of Column Totals)
I get:

The United States’ remarkable numerical dominance of the airport count (and that’s Brazil at number 2, a perhaps no less remarkable standing as well) requires another look, or set of looks. If we introduce a Slicer to the table and filter there for medium and large airports the picture changes:

The American proportion slims greatly, reflecting the weeding of small airports from the set. In fact according to Wikipedia only 16 of the world’s 50 busiest airports are US-sited, and if we slice for small_airport instead we get:
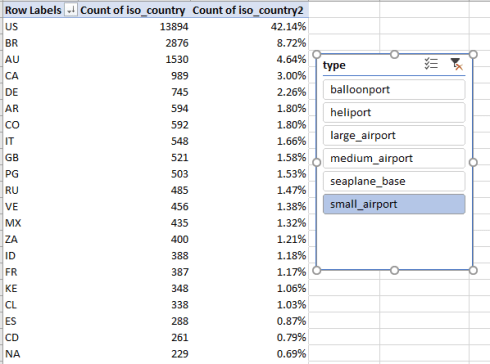
America’s rule is restored, trailed again by Brazil.
Now if you wanted to break out American airports only, and by state, you’ll have to direct your attention – and formula-writing acumen – the iso_region field in J. We see that two-character state codes sidle the right side of the region-keying hyphen, e.g. US-NJ. To extract state codes, then, we could try this expression in S2, the first pertinent cell in the nearest free column (you’ll also want to name this budding field, say US State):
=IF(I2=”US”,RIGHT(J2,2),”ZZ”)
The formula inspects the country-bearing column J for US; if it finds it, it tugs two character from the right of the kindred cell in J. Once put in place try, for starters:
Rows: US State
Columns: US State (Count, of necessity)
I get, in excerpt:

Two loose ends among the data need to be tied. First, the -A item that’s sorted itself to the head of the labels clearly promulgates an error, or given its count, a pair of errors, likely of the data-entry kind. By double-clicking the count cell of 2 an insurgent sheet adduces the two wayward records, including the airports’ latitudes and longitudes. By copying and pasting those coordinates into this site, I was told that the airports in fact operate in Indiana and Georgia.
That realization in turns calls for a find-and-replace of the errant data, but it seems that feature just won’t work with formula results, presumably because in our case you’d wind up replacing a formula with a hard-coded textual substitute and Excel wants to protect you from the inconsistency. You thus could run a copy > paste values atop S and then replace -A with IN for the record listing a 39-degree latitude, and exchanging GA for the -A lined up with the 33-degree measure (you could also find the airports’ respective Idents in column B and replace the state names in the records themselves).
The second restorative is a simple one, a filtering out of the ZZ, non-American airports. You can then sort the airport totals, largest to smallest:

Ten percent of all US airports, then, serve flyers in Texas, with runner-up California counting half as many venues. Appoint type to the Columns area and you’ll see, in part:

Note the proportion of heliports to all airports in California, though in fact a scan down the numbers puts the ratios, if not the absolute numbers, in Massachusetts, Connecticut, and New Hampshire even higher, for example.
Guess those flyers are in it for the short haul.

Leave a comment