It stands to reason as a matter of near-definitional necessity that open data in a democracy would crank open a window on its judicial system; and the United States Supreme Court seems to have obliged. The Supreme Court database, a project of Washington University that has adapted the foundational labors of the late Michigan State University Professor Harold J. Spaeth to the spreadsheet medium, affords researchers an educative profusion of information about Court doings – once you understand what you’re looking it.
That qualification broadcasts a caution to unlettered laymen such as your faithful correspondent, who’s still can’t understand why chewing food with one’s mouth open hasn’t been declared unconstitutional.
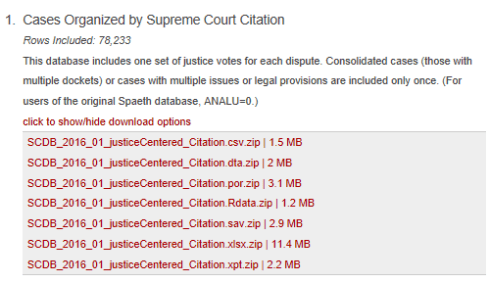
But enough about me. In fact, the database comprises a collection of datasets that breaks the Court information along a pair of variables, Case and Justice Centered Data, each of which supplies four variably-formatted sets tied to the above parameters. Here I’ve downloaded Cases Organized by Supreme Court Citation:
The workbook details yearly vote activity of Court justices dating from 1946 through 2015 (and you’ll note the parallel compendium for votes cast between 1791 and 1945); but again, you’ll need to appreciate what the workbook’s 61 fields want to tell you. (You can also conduct detailed data searches on site’s elaborate analysis page.)
For guidance, then, turn to the site’s very useful Documentation page, wherein the meanings behind the headers/fields are defined via the links holding down the page’s right pane (one quirk: the pane arrays the header/variables by category, and not by the sequence in which they actually appear in the workbook).
But we needn’t think too deeply about the field’s yields in order to issue a telling first read on the Court’s caseloads. We can move to break out the number of cases the Court has considered by year, by counting the number of unique case ids posted to column A. But there’s a hitch, resembling the one that has stalled us in a number of previous posts: because the records identify each justice’s vote per case, the case ids naturally appear in quantity – in the great majority of cases nine times, registering the number of sitting justices at any given time. (The number isn’t invariably nine, however, because occasional vacancies depress the total.)
But whatever the justice count, we want to reckon the number of unique cases the Court heard during a given year. We’ve entertained a number of takes on the matter in the past, and here’s another one, this a reasonably elegant formulation adapted from a solution advanced here. Slide over to column BJ, the one adjoining the dataset’s last occupied field, name it UniqueCount, and enter in BJ2:
=IF(COUNTIF(A$2:A2,A2)=1,1,0)
Copy the above down B (note that, owing to processing issues, the copy down may take some time).
What is this expression doing? It’s conducting a COUNTIF for the appearance of each entry in the A column (positioned in the formula as the COUNTIF criterion), the frozen A$2 serving to progressively expand the criterion range as the copy-down proceeds. If any instance of the formula returns an aggregate count exceeding one, the IF statement instructs it post a zero. Thus we’re left in uniquecount with a collection of 1’s and 0’s, the 1’s if effect counting each case id once and ignoring any additional appearances of that id. (Note as well that here we need to conduct a row-by-row count of unique entries, because the 1’s need to be summed inside the pivot table. Other formulas will deliver the total
number of unique elements in a solitary formula; look here, for example for a pretty well-known array-formulaic solution.)
Once we’ve harnessed the UniqueCount values, i.e. we’ve winnowed the data for but one citation of each case, we can put these immediately to work in this pivot table:
Rows: Term
Values: uniquecount
I get (in excerpt, after having frozen the title row):
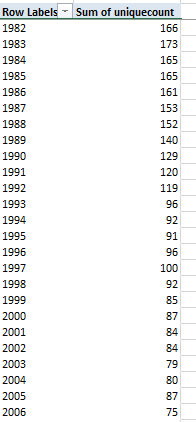
Beginning with the early 90s, the Court appears to have, for whatever reason, imposed a dramatic scale-down in cases heard see this analysis of the phenomenon). The Court adjudged 197 cases in 1967; by 2014 the number had contracted to 70.
For another, most interesting gauge of the court’s collective disposition, we could turn to the Direction parameter in column BF. Its entries are tidily binary; a 1 attests a justice’s conservative orientation to the vote, a 2 a liberal tilt. (Of course those conclusions require something of a judgement call; for a detailed accounting of the Database’s coding determinations look here.)
Some basic math should help ground the analysis. If the Court rules conservatively through a 5-to-4 vote, its Direction aggregate will figure to 13 – 5 1’s and 4 2’s, or a Direction average of 1.44 – 13 divided by 9. An equivalent liberal majority comes to 14, or a 1.56 average. A theoretical ideological midpoint of 1.5, then, centers the averages.
With those understandings in tow we can develop what could be called a directional index of Court votes, e.g.
Rows: Term
Values: Direction (average, rounded to two decimals).
I get, again in excerpt:
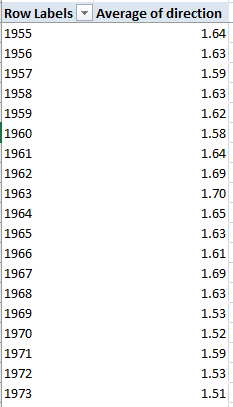
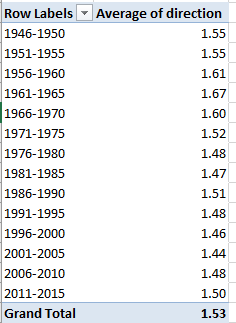
Of course, you’ll want to peruse all the averages, but the data seem to affirm the Court’s measurable movement to the right. From a relative liberal high of 1.70 in 1963, the averages begin to descend, first falling though the 1.5 divide in 1975, bottoming out in 1998 and 2002 at 1.40. The 2015 average of 1.49, however, plunks down right in the middle of the road – and a grouping of the terms in five-year tranches situates the votes for latest available interval right atop the center stripe (or 1.501996, if you insist).
A logical follow-on, then, would have us average the voting propensities of individual justices, names nicely paired with their votes in the justiceName field in BC. For good measure we can easily tally the number of decisions each Justice opined, by simply counting the number of times his or her name appears in the field (of course a Justice votes only once per decision):
Rows: justiceName
Values: Direction (average, to two decimals)
justiceName (count)
After sorting the averages smallest to largest and pasting together two screen shot excerpts I get:
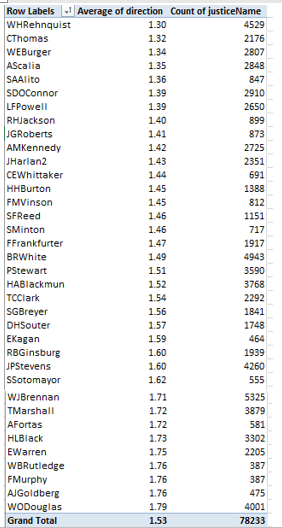
Now those tabulations are instructive, albeit not wholly unpredictable. Justices Lewis Powell, Clarence Thomas, Warren Burger, and the late Antonin Scalia hold down the farthest-right positions, with William O. Douglas – a justice publicly renowned for his juridical liberality – pushing hardest towards the left, as it were. Chief Justice Earl Warren – famously lauded and/or scored for comparable takes on the law – isn’t far behind. And for the record it was William Brennan, among the post-1945 justices at least, whose 5325 votes marks him as the most participative; but at the same time remember that the 1946 divide artificially stunts the vote totals of justices whose appointments predated that year.
But time to recess for lunch. And I know – you’ll be watching closely to see how I chew my food.

Leave a comment