With 70 years and 61 fields worth of skinny on the 78233 Supreme Court rulings spread across 1946 through 2015, there should be a lot to learn from all those data – once we decide what questions could profitably be asked of them.
What about seasonality? That is, do Court decisions, and for whatever reason, issue from the hands of opinion writers in equal measure across session months?
They don’t. Try this pivot table:
Rows: dateDecision (grouped by Months only)
Values: dateDecision (count)
dateDecision (again, by % of Column Total)
I get:
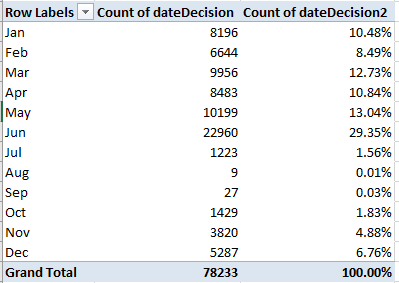
Note that yearly court sessions commence on the first Monday in October, and typically proceed through late June or early July (for more, look here. The October inception point means in turn that the term years recorded in column K actually subtend only the later months of that year, and so extend well into the succeeding one. For example, the earliest decision disseminated in 1946 was time-stamped November 18 of that year.)
We see that more than half of all Court decisions were ratified in the April-June quarter, notably swelled by the aggregate June efflorescence. One could conjecture that a need to dispose of a case backlog pressed hard against impending summer recesses might explain the flurries in June.
And what about what the database calls its issue areas, i.e. the categorical domains of the cases pled before this court of last resort, and their yearly distributions thereof? The issue area field in column AO assigns the litigations to 14 broad classificatory swaths defined here; these can be copied and pasted to an empty range in the workbook and regarded as a lookup table (which we’ll name caseIssue).
Next, enter the field title caseIssue in BK1, the free column alongside our improvised uniquecount field (see last week’s post), and type in BK2:
=VLOOKUP(AO2,caseissue,2)
And copy down (you may also want to drop a copy > paste special atop the results, a modest austerity measure that stamps hard-coded equivalents of the outcomes that condensed my file by about 600K.
But now we are made to return to the question imposed upon us in the previous post: because our data set remembers the votes of individual Justices for each case, the case ids naturally appear recurrently and, for our purposes here, redundantly – up to nine times each. In the last post we applied a formula to isolate single instances of each case in order to realize our count of cases heard by year. Here we need to conduct another count of sorts of unique entries, but one that at the same time preserves the categorical identities of the cases.
So I banged together this pivot table, for starters:
Rows: Term
Caseid
Caseissue
In addition, click Design > Report Layout > Repeat All Item Labels, a decision that reiterates the term (year) data for each record, thus overriding the standard pivot table default posting of each year but once. Turn off Grand Totals, too, and make sure to select the Tabular Form report layout.
Doing what pivot tables are trained to do, each caseid is singled out, per this screen shot excerpt:
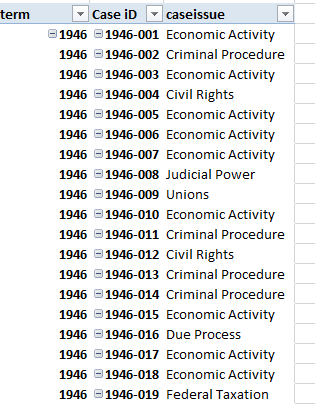
Then filter out the #VALUE item from caseissue; these represent records (485 of them) for which no issuearea data avails. Note that the Values area remains unpopulated, because we’re not concerned here with any aggregated data breakout – at least not here. Rather, we want to treat the table as a de facto data set, itself to be subject to a second pivot table.
And is that prospect thinkable? It is, and a scrounge around the internet turns up a few slightly variant means toward that end. One strategy would first have the user select the entire table and superimpose a Copy > Paste Values overwrite upon it, downgrading the table, as it were, into a mere standard set that lends itself to a perfectly standard pivot tabling.
But that rewrite isn’t necessary; in fact, you can pivot table the pivot table straight away, by first clicking outside the pivot table and, by way of one alternative, now clicking Insert > Pivot Table. At the familiar ensuing prompt:

Select the entire pivot table (but I was unable to enter the default table’s name, e.g. PivotTable1, in the field, however). Note in addition that while conventional pivot tables default their location to New Worksheet, Existing Worksheet has been radio-buttoned here; but I’ll revert to type and opt for New Worksheet, because I want the table to begin to unfold as far to the left of the worksheet as possible – that is, column A. Click OK, and the fledgling second pivot table and Field List check in onscreen.
Then the standard operating procedure resumes:
Rows: Term (grouped in tranches of 5 years)
Columns: caseissue
Values: caseissue (Count, necessarily, by % of Row Totals; as we’re now working with percentages, turn off the Grand Totals that will invariably figure to 100%.)
I get:

I hope the shot is legible. If not, the table is yours for the clicking.
I’m not sure the outcomes elaborate “trends”, but that hardly discommends them from analysis. You’ll note a rather decided drop in Federal Taxation and Union-related cases, for example, and a general upswing in Criminal Procedure hearings, even as other categories (Due Process and even Civil Rights) fail to slope straightforwardly; in any event the percentages need to be read against the absolute numbers contributory toward them, because they aren’t always large. With what is in effect a matrix comprising 14 year groupings by as many case categories, those 196 potential intersections map themselves to 8683 cases; do the math, and some of those quotients are likely to be small.
And there’s a postscript to all this, of course. Last week’s post resorted to a moderately fancy formula that managed to seek out but one instance of each Court decision, preparatory to our count of caseloads by year. Now I realize that we – I – could have done the pivot-table-of-pivot-table thing to bring about the same result, and with only one field. That is, for the first pivot table-cum-data set:
Rows: Term (in conjunction with Repeat All Item Labels)
Case ID (and Tabular Form report layout)
Then pivot table the above:
Rows: Term
Values: Count
Voila.
Hey, it’s my blog – I’m allowed to learn something, too.

Leave a comment