See the ball, hit the ball, advised the aphorist Pete Rose, with his winsome epigrammatic flair. And in fact, in the course of his day job as a major league baseball player, Mr. Rose took his reductive prescription to heart: the record shows he hit the ball 12,910 times, 4,256 of which resulted in that outcome curiously, and redundantly, called a… hit.
To be sure, Rose missed the ball – or struck out – 1,143 times, but as a percentage of his 14,053 times at bat, his 8.13% worth of misses is impressively low. And Rose would be interested to know that major league batters are missing the ball more often than at any time in the history of his chosen profession.
Batters in 2016 struck out 23.5% of all their at-bats, or .235 per the game’s three-digit formatting heritage (so don’t ask me why earned-run averages are squeezed to merely two decimals, though I have a theory); and the strike-out proportion thus far for this year (courtesy of Baseball-Reference.com) has ticked up to .241.
But that narrative of futility has been thickened by a sub-plot: major-league batters are also hitting more home runs than ever, and the dialectic of hit-or-miss isn’t quite the contradiction it seems. After all, you’ll agree it’s easy to miss a 98-mile-per-hour fastball – all the more so if your neurons are forced to contend with a 78-mile-per-hour curve ball instead. Surprise. But manage to make contact with that fastball and the results could go a long way (see this consideration of the home-run/strikeout relationship in the New York Times, with particular attention paid to the home-run half of the equation).
To learn a bit more about the home-run/strike out antimony it would be a good idea to consult Sean Lahman’s free, go-to Baseball Database, as we have in earlier posts (look here, for example. Remember that Mr. Lahman will happily attend contributions.) Click the 2016 – comma-delimited version link, and another click upon the resulting zip file will empty its spreadsheet files into its folder. Then call up the Teams workbook. (Note Lahman advises that the files work best in a relational setting, but our analytic interests here can be sufficiently served by Teams all by itself.) Once we’ve gotten here we can throw a few simple calculated fields into a pivot table to productive effect, and join them up with a couple of applications of the CORREL function for our information.
To start, we could drum up yearly strikeout percentages – that is, strikeouts divided by at bats, and then for presentation purposes proceed to group the outcomes by say, bins of five years:
Rows: yearID
I’d group the years thusly:

I’ve earmarked the above span because some of the pre-1910 years have no strikeout data, and because the 1912-2016 interval comprises 105 years, yielding 21 equally-sized tranches.
Next I could devise this calculated field, which I’ve called sopct:

And garb the resulting values with this custom format:

And filter out the <1912 data.
When the dust settles I get:
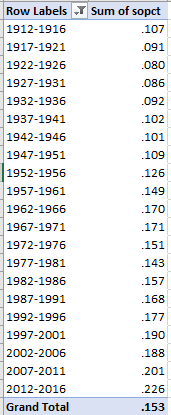
The ascendancy of strikeouts is clear. Note the distinctly impermanent fallback in the strikeout percentages in the 1972-1981 era, a predictable and intended consequence of the lowering of the pitching mound in 1969 and its literal levelling of the playing field for hitters. But nevertheless the trend soon recovered its arc.
We could next calculate a similar field for home runs, calling it hrpct:

Applying a similar grouping and formatting to the field, I get:
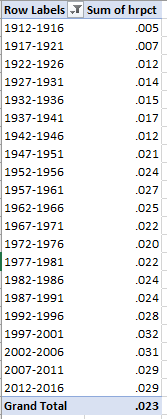
The trendline is considerably flatter here, and indeed seems to have peaked during the 1997-2001 tranche – not surprisingly, because it was during that fin de siècle epoch that steroid use among ballplayers apparently peaked as well, thus fomenting, among other mighty anomalies, Barry Bonds’ surreal 73 home runs in 2001, and in 476 at bats. Ungroup the yearID field momentarily and treat the numbers to a four-decimal format, and you’ll discover a home-run high of .0340 in 2000 – but note the .0339 for last year as well, succeeded in turn by this year’s all-time, relatively drug-free .0368 (again, check Baseball Reference for the to-the-minute totals).
Now what then about the association between strikeouts and home runs? Baseball common sense would predict an appreciably positive correlation between the two; the harder the swings at those fastballs, one could suppose, the more misses – but along with these flows the expectation of more long balls, too, once and if bat actually meets ball.
To palliate our curiosity, we can trot out both sopct and hrpct into Values, and continue to leave yearID ungrouped. With the strikeout and home run values stationing themselves into columns B and C and the year 1910 making itself home on row 43 – a positioning that by extension locks the 2016 data into row 149 – I can enter, somewhere:
=CORREL(B43:B149,C43:B149)
That expression returns a most, almost unnervingly impressive, .845, shouting the view that, as strikeouts go, so do home runs – and virtually in lockstep.
We can then go on ask about the relationship between strikeouts and batting average. Might it follow that, with the increasing, overall failure to hit the ball, averages should falter correspondingly – simply because fewer balls will have been put into play? You can’t get a hit if you don’t hit the ball, it seems to me. Or do we allow that because hard swingers hit the ball harder (when they do) – that a hard-hit ball is harder to catch?
We can check that one out. We can mint still another calculated field, which I’ll call baagg (for batting average aggregate):
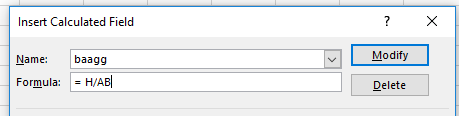
Replace hrpct in Values with baagg, leave sopct in place, and because the operative ranges don’t change the CORREL we authored above should rewrite itself, yielding -.477 – a notable inverse association (that’s a minus sign preceding the value, not a dash). That is, as strikeouts mount, batting averages do tend to respond downwards. And while it’s true that -.477 isn’t .845, most social scientists would be thrilled to even have that number crunched upon their desk.
And I suspect Pete Rose is smiling, smugly, too.

Leave a comment