The Intermediate tine of the three-pronged New York Times data journalistic syllabus casts its analytic lot with pivot tables, and the kinds of questions properly placed before that mighty aggregating tool. Among its several data offerings awaits a 2900-record gathering of New York (i.e. Manhattan) real estate data, naming property owners, their holdings and their assessed value, and a trove of additional metrics. Per the course’s pedagogical remit, the learners are prompted to pose a few questions of their own of the data – surely a useful heuristic – before they turn to the assignments at hand, which among other things asks “What are the things you notice about this dataset that shows it isn’t perfect?”
A good, important, and generic question, one that nevertheless isn’t advanced by the Census data sheet we reviewed in the previous post. In fact, worksheet data imperfections can assume at least two forms: a discernible scruffiness among the records, and/or design impediments that could constrain analysis, and I’m conjecturing the Times wants it staffers to concern themselves with flaws of the former stripe.
For example, if this qualifies as a blemish: once downloaded to Excel, both the start and end_date year entries present themselves in text form, thus obstructing any unmediated attempt to group those data. Yet the year_built data remain indubitably numeric, and I can’t account for the discrepancy. But at the same time, however, these data in their native Google sheet mode appear appropriately numeric, and when I copied and pasted some of the start dates to a Google sheet of my own they behaved like good little values; and moreover, the left orientation imparted to the numbers in the end_date field suddenly righted themselves (that was a pun intended) via my paste. Another Google-Microsoft lost-in-translation flashpoint, perhaps, and not a species of data imperfection, if one remains in Sheets. (Another note: I’ve been heretofore unable to actually work with the Times sheets in the their Google trappings, as access to them defaults to View Only, and seems to require permission from the sheet owners in order to actually work with them. My requests for permission have gone unrequited to date, but in fact you can copy and paste the data to a blank Google sheet and go ahead. The data are open-sourced, aren’t they?)
Far more problematic however, and presumably one of the data failings over which the Times hoped its learners would puzzle, are the disparate spellings in the owner_name field of what appears to be the one and the same New York City Department of Housing:
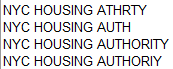
(Note the last entry above is simply misspelled. The data were drawn from the coredata site, by the way, a project of New York University’s Furman Center.) And, while we’re at it:

But the Times’ marching orders don’t oblige its learners to proceed and do something about the inconsistencies. Absent that determination, no accurate answer to the Times’ question (number 6) – “Which owner has the most buildings?” – can be enabled. Remember that the Intermediate unit is pivot-table-driven, and any table invoking the owner_name field is going to loose the untidy spate of spellings reported above.
Yet one more imperfection besetting the selfsame owner_name field is the formidable complement of cells – 381 of them, to be exact, or about 13% of all the records – that contain no owner name at all, a lacuna that likewise comprises the analysis. The Times asks its learners “Who are the biggest owners in each neighborhood based on the number of units? Limit your table to owners who have more than 1,000 units”, an exercise which would appear to call for a pivot table that looks something like this:
Rows: Neighborhood
owner_name
Values: res_units (filtered in the Rows area for sum of res_units equal to or greater than 1000)
And that alignment of parts kicks out a set of results that, in excerpt, embody the problem:
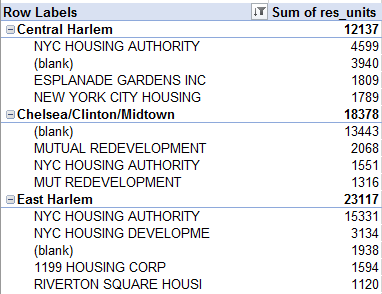
Indeed, both data shortcomings – the blanks and the variant spellings – degrade the findings prohibitively.
The Times also wants its learners to “Compare the average value per unit for different neighborhoods. Which is the most expensive and which is the cheapest?” That chore seems to call for a calculated field, e.g. in Excel:
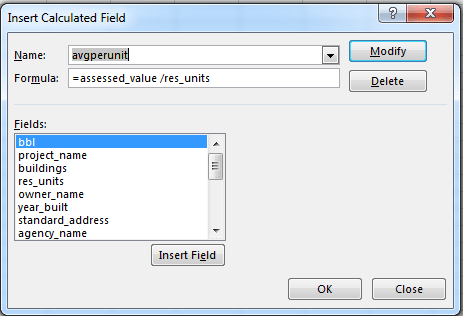
I’m just wondering if the Times cohort learned the equivalent feature for Google Sheets; perhaps it did, after all. Its Data Training Skills List merely records the Pivot Tables rubric without elaboration. (Note in addition that the housing data sheet hoards an Income sheet from which the Neighborhood population, income, and diversity fields on the Housing sheet have been presumably drawn, probably through a series of VLOOKUPS whose yields have been subject to a mass Copy > Paste Special routine directed to the Housing sheet.)
Of course, that surmise points to a larger question: the breadth of spreadsheet capabilities spanned by the Times training. How, for example, were learners expected to apply themselves to this assignment: “Which neighborhoods will be most affected (in terms of number of units) in each of the next 10 years by expiring subsidies and which one is the most secure?” I’d try this:
Rows: Neighborhood
Columns: end_date (filtered for years 2019-2028)
Values: program_name (Count, necessarily; the data are textual)
And my table looks like this:
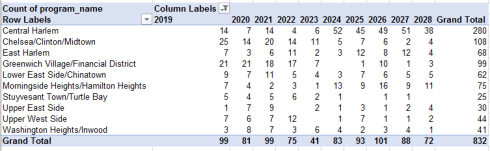
Thus Central Harlem is the neighborhood most vulnerable to short-term expirations of program subsidies – by far – with the Stuyvesant Town/Turtle Bay district, really a mélange of sections on Manhattan’s East Side, the least exposed. But does my pivot table approximate toward the strategy the Times was seeking? Again I don’t know, but a conversation with the paper’s syllabus architects about their intentions for the exercises would prove instructive – at least for me.
And that conduces toward the inexorable follow-on, then: I’m happy to offer my services to the Times, in the edifying form of a weekly column on spreadsheets, and for a magnanimously modest emolument; and I’d make myself available to help with the in-house training, too.
Just one question: will my press pass get me into all the Yankees games for free?
Addendum to the above: My previous post recounted my inability to access and edit the Times’ files in native Google Sheet mode. The paper’s Elaine Chen did get back to me yesterday (July 16), pointing to the File > Download alternative. One assumes, after all, that Times doesn’t want to approve shared file access for the multitudes, and probably for good reason. I should add that if one downloads the data in CSV instead of Excel mode, the formatting discrepancies I described in Part 1 seem to disappear.

Leave a comment