It was Fitzgerald, I think, who observed that the British are different from you and me – or something like that. Indeed – if the collective “me” denotes Americans, and the differences singularize the British higher-educational system, he was right.
Here in the UK – and very much unlike the States – nearly all university admissions seekers (and don’t synonymize “university” and “college” here; “college” throws a loose cordon around a vast skein of pre-university preparatory institutions) place their credentials before the Universities and Colleges Admission Service or UCAS, the central, one-stop shop for applications to degree granters across the country (undergraduates can’t apply to Oxford and Cambridge in the same year, by the way, if those venues hold down the top rows on your wish list).
Concomitant with its charge, UCAS makes a good deal of its yearly data available in spreadsheet form at
http://www.ucas.com/about_us/stat_services/stats_online/annual_datasets_to_download/
and also happens to evangelize pivot tables to its site visitors. One if its workbooks – the memorably-named inter_v2_12.xls – provides a good case in point:
What enriches these data is their complement of six substantive fields, and the very large number of telling pivot tabling possibilities it encourages as a result. Yet the field names themselves could stand a measure of explication – at least to foreigners, whose demographic includes your correspondent. To me, Found Deg Choices, the heading posted atop column H, for example, signified some manner of discovery of degree types by applicants; but in fact it denotes Foundation Degree Choices, a sort of pre-university credential that can be routed towards an eventual B.A. Wouldn’t “Found.” have gone some way toward relieving the ambiguity?
By the same token, I was clueless about HND. Click the International link sidling that data category on the UCAS dataset page referenced above and you’re faced with a legend of field names:
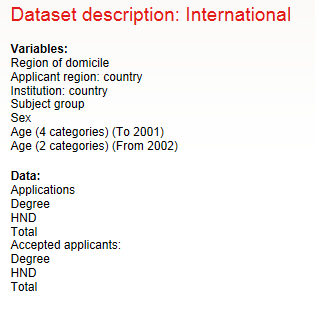
Not much help to the clueless there, though you’ll note the Region of Domicile elaboration of what on the actual workbook is called Domicile (in the A column). Thus it took a bit of foraging until edification came; HND stands for Higher National Diploma, an attainment described by one education board as
“A vocational qualification, usually studied full-time, but can be studied part-time. It is roughly equivalent to the first two years of a three year degree level study” (click here for the details, and here for a listing of program/course types).
I should add that my British-born wife immediately recognized HND – but then, she’s British.
And note that the legend cleaves the workbook’s fields into two camps – Variables and Data (witness that red line describing the boundary between columns F and G), an intelligible but idiosyncratic bit of apportioning that means to fence off qualitative, grouping variables from those numeric values meant to be grouped. The problem of course is that pivot tables can literally count those Variables, and so treat them as data, too.
But returning to those six fields or variables, i.e. (Region of) Domicile (a superset of the next field), Applicant Country, Institution Country, Subject Group, Sex, and Age – we must acknowledge that, according to my tyro math, hundreds of pivot table permutations are there for the conjuring; and with nearly 19,000 records to work with, there has to be something interesting in there, and at statistically significant levels (NB: the application numbers reported herein tabulate the aggregated school choices expressed by applicants, and not the discrete individuals who’ve submitted their names for consideration. UK applicants may apply to up to five institutions; the totals here thus far exceed the finite totals of actual students. Accepts, however, identify real, determinate students only. Thanks to Hannah at UCAS for the clarification.)
For example: by breaking out the subject preferences inventoried by this pivot table:
Row Labels: JACS3 Subject Group
Domicile
Column Labels: Gender
Values: Deg Choices (as per Show Values As > % of Row Total) and
(Sum of) Deg Choices (Degree Choices stands as by far the largest institution type to which students apply)
a most interesting set of cross-cultural breakouts obtain. Then drag Domicile away, and slip Applicant Country into the Report Filter area. You’ll find, for example, that 62.7% of American applications to the Medicine and Dentistry subject were filed by women, as were 74.97% to the Biological Sciences. Turn to Engineering and Computer Sciences, however, and the respective numbers retract to 29.82% and 22.28%. These disparities appear more-or-less worldwide, even characterizing equalitarian Scandanavian countries. (100% of the 167 Norwegian applications to Group D – Veterinary Science, Agriculture, and related subjects – emanated from women. Note in addition that Applicant Country resolutely breaks out UK residents by country – that is, England, Scotland, Wales, and Northern Ireland).
Or try another simple but revealing table:
Row Labels: Institution country (that is, the UK country in which the desired school is located)
Values: (Sum of) Deg Choices
Report Filter: Applicant country.
We see that English-resident applications to English institutions totalled 95.55% of the whole – no surprise there. But French applications to Scottish schools, on the other hand, amounted to 22.90% of all submissions; the Scotland-bound figure for American applications reads 22.66%.
And that’s just a taste. You may also want to download spreadsheets from the Institution/Age area, in which the data break out age into eleven gradations, a far finer grain than our workbook’s merely binary 20 and under and 21 and over.
In short, there’s lots of stuff in there, and with all those variables and fields maybe something revelatory. Data journalism indeed!

Leave a comment