It doesn’t take much to make me happy – a loaf of bread, a jug of wine, and a couple-hundred thousand records worth of data to play with. What else does a guy need?
OK, so I’m low maintenance – but what about that dataset? I’m thinking about the monthly data racked up by Citi Bikes, the quick-ride bicycle rental service sponsored in large measure by Citi Bank, the firm whose name bears a serendipitously close resemblance to that of the service itself (must be another case of monkey-at-the-typewriter; it just happened, I guess). I downloaded the data for February 2014, the latest (and smallest) workbook on offer, here:
http://www.citibikenyc.com/system-data
The above superlatives aside, it’s still a big file – 224,000 records big – but nothing you can’t handle.
A cousin of sorts to London’s Boris Bike and Paris’ Velib schemes (though that latter, far smaller city has far more biking stations than New York does), Citi Bikes rents the two-wheelers from docking stations 24/7 to denizens needing to get here-to-there with dispatch; it’s a cheaper deal than a cab and, given the New York’s viscous streets , very possibly faster.
Bear in mind that Citi Bike isn’t citywide. “Station locations are based on population and transit needs, and were selected through a participatory public input process”, its web site lets us know; what it means right now is that its 330 stations teem in the lower half of Manhattan and certain next-big-thing districts in the west of Brooklyn, (check out its real-time bike-availability map here). As such, one could properly ask if its cycling demographic could be extrapolated to the remainder of the city, much less anywhere else.
In any event, an analysis of the Citi Bike data by Sarah Kaufman of New York University’s Rudin Center for Transportation Policy and Management has something to say about biking and gender, at least among Citi Bikers – namely that far more men – about 68% – lean over the handlebars then women, comparing notably to England’s 73% (see this review, which also points to an upward slope in female cycling in London), even as the Netherlands edges toward parity (Kaufman allows that with wider city coverage of biking services the ratio in New York should flatten as well). In relative terms, the female biking presence looms larger in Brooklyn (see Kaufman’s report).
Now to the workbook, and a few data quality issues. First, 6717 records – about 3% of the whole – bear no birth date and gender information; these absentees belong to a cohort Citi Bike calls Customers – riders who purchase one or seven-day user passes and presumably aren’t duty-bound to complete their dossiers. The remaining 97% or so are Subscribers, who remit an annual membership fee entitling themselves to “free” 45-minute rides, after which overtime charges begin to gnaw at their credit cards. Thus if you want to break out the rides by age and/or gender you may want to sort the empty records to the bottom of the stack, and loosen them from the data set with our tried-and-true empty row technique (but don’t delete the records; you may want to rejoin them for other breakouts. You could also filter these inside a pivot table, but admitting blanks to a table could court grouping problems). There are also 101 rides ostensibly launched by men (yes, all men) born in 1917 or earlier – a spry bunch to be sure. And finally, note that the data track numbers of rides, not the numbers of discrete individuals taking them.
Those qualifications in place, dock your mouse in the gender field and its numeric codes – 1 for male, 2 for female, and 0 for those unknown Customers. Those identities are workable, but for presentation purposes I’d substitute alphas M for 1 and W for 2 via a pair of Find and Replaces, assuming your PC can withstand 224,000 worth of replaces. And there’s no shortage of interesting data combos spearheaded by gender , e.g., this pivot table hour of ride inception by gender:
Row Labels: starttime (Group by Hours only)
Column Labels: gender
Values: gender (Count)
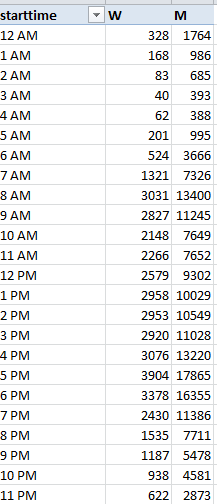
Bet you’re itching to know where those 433 riders actually went between 3 and 4 AM; well, the information is in the data set. (And note that female rides in February accounted for only 19% of all journeys, at some substantial remove from Sarah Kaufman’s global 32%).
And to uncover the gender proportions across the above times, click in the Values area and step through PivotTable Tools > Options >Show Values As > % of Row Total:
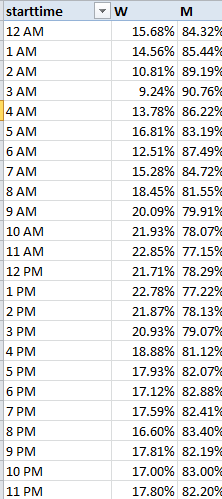
Female ridership peaks in midday, and you’re probably unsurprised by its decided underrepresentation at 3 AM.
And then I had a bright idea, an event of sufficient intermittency to leave me no choice but to share it with each and every one of you. The Citi Bank dataset my well be the first I’ve encountered in which each of its records incorporates a pair of latitudes/longitudes – the first fixing the point of ride inception, the second its terminus. And so it seemed to me that if you could plot the distance separating the two latitudes and then the comparable interval for the longitudes, you’d have in effect measured the two perpendicular sides of a right triangle, whereupon the no less tried-and-true Pythagorean theorem could be called off the bench to calculate the distance between start and end stations. Remember a2+b2=c2?
It sounds downright doable, and in fact it is; indeed, I was avid to recount just how and to the inevitable peals of reader appreciation, when Pythagoras tapped me on the shoulder, took me aside, and in his best broken English reminded me that his hypotenuse describes an unrelentingly straight, as-the-crow-flies line, the kind of locus beaming through Manhattan’s rectilinear uproar that only a crow – or a helicopter – could navigate. In reality, though, on-the-ground biking distances could, and probably should, be totalled more unassumingly, by simply adding the latitude-to-latitude and longitude-to-longitude distances – that is, two of the perimeters of that right triangle. Square root? No – more like a square route, then.
Having twisted the dimmer down on my bright idea, let’s try then to pace off the distance of Feburary’s very Citi Bike first ride (sorted chronologically by Citi Bike in row 2), one embarking precisely at midnight from Washington Square East in deepest Greenwich Village, and coming to rest at 12:06:22 at Stanton and Chrystie Streets in the storied Lower East Side.
So what do we have to do? First, understand that lines of latitude are spaced equidistantly up and down the planet (or so the web tells me), with contiguous latitudes subtending about 69.65 miles. Thus, with the start and end latitudes declaring themselves in columns F and J, let’s claim the P column and write in P2
=ABS(J2-F2)*69.65
I get about .571. The ABS function relieves a formula’s result of its sign, such that applying ABS to either 3-7 or 7-3 will return just 4; and since we can’t know when subtracting a ride’s end latitude from its start will output a negative number (depending on the rider’s direction), the ABS enables us not care about it.
Marking off the distance between any two longitudes is a touch more pause-giving, because these verticals radiate from the poles, the distances between them dilating as they near the equator. After some stops and starts across the web I came up with a New York-specific inter-longitude distance of about 52 miles between degrees. Going with that, let’s creep into the Q column and enter in Q2
=ABS(K2-G2)*52
Here I get around .221. Add .571 and .221, or
=P2+Q2
in the R column and our midnight cowboy seems to have pulled into Stanton and Chrystie Streets around .792 miles after he started (Pythagoras would have gotten around .61 miles, by the way).
Of course we’re approximating (after all, Broadway traces a hypotenuse-like diagonal through much of Manhattan), though I think our guess is pretty sound; but for rigor’s sake I turned to Stephen P. Morse’s cool distance-calculation site, on which users can submit pairs of latitudes and longitudes and learn how far it is from A to B . Working with my original Pythagorean metric and comparing my numbers with Morse’s (who seems to be working with right triangles, too), my numbers reached a 99% agreement with Morse’s; and after playing around with our original New York 52 miles-per-longitude and bumping it down to 49.2 miles I came closer still to Morse’s values. Thus by substituting 49.2 for 52 in the formula above, I would up with a trip of .780 miles.
Whew. In any case, if you’re agreeable to the above you can copy the =P2+Q2 formula in R2 down its column (and name this field) and hasten to pave it all over with a Copy > Paste Special > Values, thus sending 220,000 byte-eating formulas packing. And you could probably delete the P and Q columns, too, dispelling another 440,000 formulas; those data have already played their part.
And now you can do some neat stuff. I told you I was happy; but now it’s time for lunch.
Hey – anyone know where that loaf of bread went?

Leave a comment