You get 45 minutes, you’ll recall, before your free (as it were) Citi Bike ride shifts into overtime and the journey begins to take its toll – literally:

That + sign requires elaboration, herewith furnished in an email from a Citi Bike staffer:
“Trips that are shorter than 30 minutes are no extra charge. Trips longer than 30 minutes incur overtime fees. After the initial 30 minutes, it’s an additional $4 for the second half hour, $13 for the third half hour, and $12 for every half hour after that. A trip begins when a bike is unlocked and ends when a bike is securely returned to any Citi Bike station.”
Keep those pricing strata in mind. In any case, because our Citi Bike data stopwatches every ride’s duration – in the very first field, in fact – we’re ready to run with that variable (inapt transportational metaphor there – sorry).
But note that the duration data express themselves in seconds – and because minutes is the more negotiable currency here I’ll call upon a simple transformational tool, one I confess to have badly underused. Enter 60 in any blank cell, and copy it. Select all the tripduration data in column A, and click Home > Paste > Paste Special…Divide:

And format to two decimals.
Paste Special Divide smartly substitutes for the traditional paste value routine – i.e., the inserted column, in which values in the source column are formulaically divided by 60 in the new column and pasted back via the Values option. Paste Special Divide here seems faintly circular, with a kind of self-referential division and paste-back slam-banged into the same cell. But it works.
Once done, you could plant a simple AVERAGE in at the underside of column A and learn that the mean Citi Bike trip in February lasted 14.58 minutes, thus jibing with the riders’ purpose-driven riding intentions (that number compares interestingly with Washington DC’s 13.75-minute average for the first quarter of 2014; see those data here). Citi Bikers probably have to get somewhere soon; exercisers and riders in the park don’t start their picnic just 14.58 minutes after they’ve screwed their helmets on.
Now sort the durations in descending order and look for the value 45. Again, that’s the threshold in minutes after which the Citi Bike billing scheme begins to achieve lift-off. You’ll find that the 45ers and beyond command 2921 rows, or an intelligibly small 1.3% of all the February rides. But look at the first record. It archives the activity of a woman, née 1982, who decoupled her cycle from the South Portland Avenue and Hanson Place dock in the Fort Greene quarter of hippest Brooklyn at 3:52 on February 8, and redeemed her vehicle at the posh Grand Army Plaza and Central Park South station, hard by the Plaza Hotel, at 12:41 on February 17 –12768.47 minutes, or nearly nine days, later.
What went on here? Do we have a case of extreme right-tailed forget fullness, or a grave Citi Bank typo? Or is there a tale to be told about those nine wintry days in February? I for one am clueless, but cluelessness begets its prodigies of speculation; and at the very least I sense a New Yorker short story in there, or a maybe a TV movie. How about Clare Danes for the lead?
I do go on, but there one thing about the cyclist who wasn’t there that we can know for sure. Throw 12768.47 minutes into Citi Bike’s multivariate pricing equation and go figure; and when the lead snaps in the pencil the total charge for our lady in (the) red reads … $5057.88. You’re welcome to check my math, but I get 419.116 half-hours at $12 per, and she was probably charged another 12 bucks for the .116 besides. Does anyone have Clare’s number?
But while you work on that, you can spend a bit more time on the rest of the data, which has lots to offer. For example, how about a pivot table listing of the ten busiest stations from which trips get set in motion? That one’s easy, for starters:
Row Labels: Start Station ID
Values: Start Station ID (Count)
Then right-click in the Row Labels and click Filter > Top 10… and click ok in the resulting dialog box.
The for addition ID slide Start Station Name into Row Labels beneath Start Station ID, and see to it that the report layout is set for Tabular Form, and with all sub and grand totals turned off:
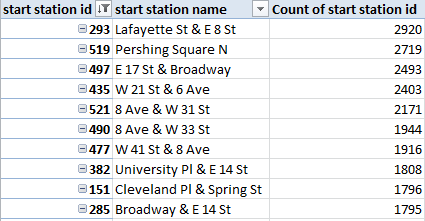
It helps to be a New Yorker here, but if you aren’t, trust me – all of the above are in Manhattan.
The options keep coming. Try adding trip duration to Values and:

Those numbers are seven-figured; riders did nearly 2,000,000 minutes, or almost 32,000 hours’ worth of traveling, from the Lafayette/East 8th embarkation point (even as the Pershing Square station in midtown clocked more time with fewer trips). (Note: if your top 10 Values numbers don’t sort descendingly – as mine didn’t – go here: right-click in either Row Label field and click Sort > More Sort Options… and observe below:

So what about end stations? Barter the parallel start station fields for their end station equivalents and don’t touch the tripduration sum:

(And you may have to attend to that sort order nicety once more.)
Again, it’s the intersection of Lafayette and East 8th Streets that holds pride of cycling place, and it stands to reason: after all, if one travels from A to B, the prospects are good that a return trip to A bulks large on the itinerary. Indeed – the start and end Top 10s share nine stations. (And if you want those expand/collapse buttons to disappear – at least in version 2010 and above – click in the pivot table and proceed to PivotTable Tools > Options > Options in the PivotTable button group and:
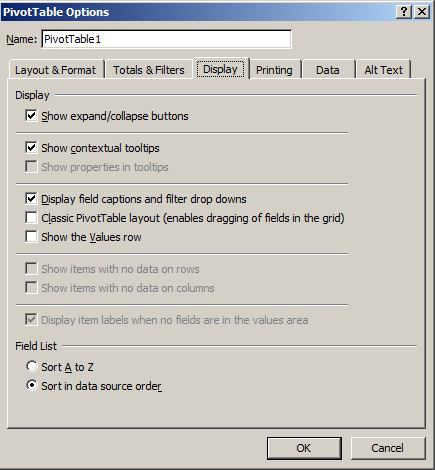
Tick off that first display box.
Again, the analytical possibilities here are quite considerable. How about breaking out average trip durations by both time of day and gender?
Row Labels: starttime (group by Hours)
Column Labels: gender
Values: tripduration (Average)
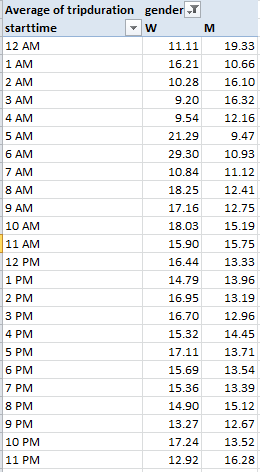
Note that male trips are longest in the midnight hour, a datum that remains to be thought about; and while the trough in women’s durations at 3 and 4am is expectable, the contiguous spikes at 5 and 6 perhaps aren’t. And why are women’s trips (and there were 524 of them) nearly three times longer at 6am than men’s? In fact overall, female trip durations exceed males’, 16.22 minutes to 13.57. (And yes, you’ll collect different average durations if you import endtimes instead.)
There’s quite a bit more to look at in here, but I gotta go; my movie idea is gaining traction, and I mustn’t keep Harvey Weinstein waiting.
He takes my calls, you see. Hey -we went to the same high school.

Leave a comment