Even as the lexical imperatives of wordplay bid us to label MOOCs the next big thing, the higher-education jury continues to deliberate their outsized promise just the same.
MOOCs – or Massive Open Online Courses – make their syllabi available to just about anyone with a dongle and a dream of learning a university-level course, and on just about anything; and again, while the intersection of access, pedagogy, and affordability can get jammed, at least we have some massive data on the matter with which to work now, a recent courtesy of EDX, the consortium running the show for the MOOCs conducted by Harvard and MIT.
And yes, the workbook is appropriately massive, socking more than 640,000 entries into its groaning rows and into the storage device of your choice, here. You’ll also surely want to grab hold of the Person Course Documentation PDF from the same page, defining as it does data field and the MOOC course names.
Each of the 640,000 rows IDs a student enrollment in a MOOC, and because each registrant has a Constitutionally-protected right to grab a virtual seat in more than one course the data thus do not individuate discrete students, even as that information might be something you’d want to have; after all, you might very well want to aggregate gender and nationality, for example.
Indeed – if you extemporize a single-field pivot table, namely
Row Labels: userid_DI
And provided your processor cooperates, you’ll shake out 476,532 unique student IDs onto the table; and so it seems to me that if you do want to do something with these you’ll need to stamp them into a separate, subsidiary data set, by pivot-tabling the IDs and companion fields and then running a copy-paste special-values right atop it, reducing the data to a standard, slimmed-down collection of records (and it’s far easier to play around with a data set than pivot table results). On the other hand, the original 640,000 entries we downloaded continue to be of value, too; they can account for class enrollments by gender, for example, in which the discrete defining units are the classes themselves.
So here’s what I’d do: poke these fields into a pivot table, e.g., something like this:
Row Labels: userid_DI
final_cc_cname_DI (country; to be discussed)
gender
YoB (that is, year of birth)
LoE_DI (in effect, highest academic credential)
And turn off Grand and Subtotals and turn on Tabular layout.
But it seems as if my primo idea isn’t problem-free. Eye the first few records of the table:
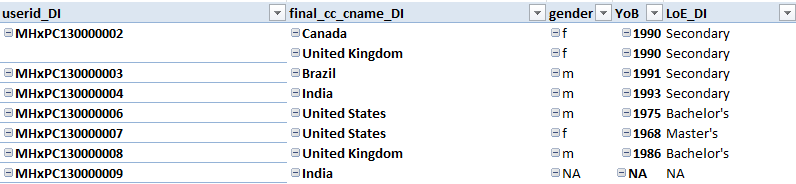
It’s that first record that’s plowing the furrows in my brow. That person – a she – is enumerated twice, asserting national affiliations both to Canada and the United Kingdom. And that means, so to speak, she’s indiscrete – she’s being counted twice.
Explication, please. According to MIT’s Jon Daries, those country data derive from one of two sources: the modal IP address of the student that is the IP that registers most frequently across their interactions with the course), and if that isn’t available or inconclusive, the workbook picks up the country that the student may (or may not) have offered in a MOOC survey.
And that means that what the country data do not invariably portray is citizen nationality; rather, the field serves up (rather literally) in the first instance a student’s predominant user location, and only then, absent a definitive IP reading, a student-provided terra firma coordinate, which may not correspond to nationality either. Thus a good many students who’ve signed on to more than a single course) check in with multiple countries (about 20,000, still only a jot more that 4% of the global student contingent, and I do mean global) too, a consequent of their world-wide hops, skips, and jumps. And for we, the record-keepers, that very itinerancy, a perfectly practicable and pleasing prospect for the distance learners themselves – poses a problem, because right here, we want to be able to count each student exactly once.
And so after much beard-stroking, it seems to me that discretion as usual trumps valor. I’d simply extirpate final_CC_cname_DI from the above pivot table, and then commission another compensatory table:
Row Labels: userid_DI
final_CC_name_DI
And we can figure what to do with this one later.
In any case, once we sign off on those decisions (although I’d use invisible ink if I were you), click in our first table and turn to PivotTable Tools > Options > Select (in the Actions button group) > Entire PivotTable, click Copy, earmark a destination (it could be a new workbook if you wish), and punch in a Paste Special > Values (a straight copy-paste would have merely duplicated the pivot table, but here we want plain old records, in their pre-table state. Note as well that all the fields were zoned into the pivot table’s Row Labels area; any reassignment of any of these into Values would have quantified them prematurely. But we want to preserve the original qualitative data here in the pasted data set).
And for those of you who can’t get enough of the complications, I discovered that this new, values-pasted iteration brought along a minute hold of blank student ID records – 17, if you’re counting, almost certainly a residuum from students who, having registered for multiple classes, reported their highest education in only one of these; and their actual IDs are blanked here in the pasted data because pivot tables default to an outlining format in the Row Labels area, thus actually inscribing each unique ID but once (as per the first screen shot here, for example). So here you need only conduct a Z to A sort and then just delete the 17 bottomed-out records. And for a final, if obvious caution, you’ll see that many of the gender, date of birth, and highest education cells yet remain blank; these data simply appear to be unavailable.
Be that as it may, now we can actually start doing something with these data. Begin with a simple gender breakout of the MOOC students (remember again we’re working with the copy-and-pasted data set):
Row Labels: gender
Values: gender (Count)

Then filter out the blanks, NAs, and Os:
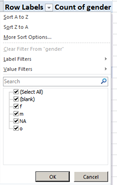
(I assume the data coded O point either to transgendered individuals or some data corruption; if you roll through the records you’ll also see that many of these show no data for any of the fields other than ID. And note as well that all subsequent pivot table shots here will have filtered the blanks and kindred data out.)
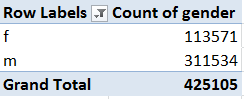
You should be left with something like this:
Impose a % of Column Total upon the above breakout:

(You don’t really need the Grand Total here, either).
In light of the general 57%-43% female-male apportionment of the general US college population, the data above are rather striking – but remember that the Harvard/MIT MOOC student body, as it were, is far from exclusively American, as we hope to demonstrate later.
And what of highest education by gender?
Row Labels: gender
Column Labels: LoE_DI (of course you can rename these gnarly fields, right in the table)
Values: gender (Count, and % of Column Total)
![]()
(Percentages read down each column.) Striking as well – although perhaps more subtly so. The distinctly minority women’s MOOC cohort here is nevertheless the better-educated, and in rather straight-line fashion, intimating some particular women’s self-selection mechanism (and note: while the column labels above exhibit the default alphabetic sort order, you can reorganize them hierarchically by right-clicking the labels, clicking Move, and observing the sub-menu instructions, e.g.)
![]()
And what about Year of Birth? Good question – I’m still working on that one, because I’m getting over 800 students born in the 21st century, including 61 who arrived in 2013. I mean, I know those folks at Harvard and MIT are smart, but are they really teaching neurolingustics and differential calculus in their day care centers?

Leave a comment