MHxPC130493603 is an accomplished young woman. MHxPC13, as her friends call her, extended her avocational reach by signing onto the Harvard MOOC Justice course last year, the self-same year in which she finally earned her Master’s degree. I know she achieved that credential last year, because according to her MOOC registration she was born in 2013, thus rather narrowing down the possible dates of completion.
OK – we can’t use that date. We’ll either have to write MHxPC13 off as a smart aleck, or relearn the lesson that data entry has its vagaries, and mistakes can and do sporadically suborn the process (MIT’s ever-helpful Jon Daries tells me because YOB information is user-supplied, the first-named accounting likely applies). It’s not as if we haven’t met up with date outliers before, because we have; see the March 27 and May 15 posts, for example, but in any case these birth-date impossibilities have to be filtered out, if the authentic dates of birth are to teach us anything about the MOOC cohort.
And the NAs and (blanks) that command a very considerable number of the YOB cells need to be overturned as well, in part because a pivot table’s Group Selection potential is sabotaged by any non-numeric miscreants in a grouped field. So here’s what I’d do: run two Find and Replaces in the YOB column (remember that we’re working here with that copied-and-pasted-worksheet I described last week, drawn from the EdX downloaded source), one replacing NA with 2013, the second exchanging (blank) for 2013. Since we need to filter 2013 anyway (and I’d filter any date from say, 2000 and beyond. It’s not altogether unreasonable to imagine a 15-year-old essaying a MOOC, though), and because that value, however useless, is numeric, no additional harm will be done the data by imputing the 2013 to the NAs and (blanks).
And once those dummy 2013s have taken their places, we can pivot table away, starting with a simple census of MOOC devotees by age, grouped for illustration’s sake by bins of three years each (again, recall that we’re working with unique student IDs):
Row Labels: YOB (grouped in three-year bands; then filter the bands starting with 2000-2002)
Values: YOB

Then fit YOB into Values again, this time cast into % of Column Total mode:

It isn’t – and is – surprising to find 63% of the MOOC takers crouching beneath the 30 age mark, surprising perhaps in view of the universalizing promise of the MOOC idea. It’s clear that captivation with the Harvard/MIT offerings isn’t smoothly distributed across the age demographic.
And what about the offerings themselves? That question returns us to the original EdX data set, along with the Person Course Documentation PDF and its course-code identities:

I for one would be interested in a gender-enrollment breakout by course (remember again that the pivot tables presented here will have filtered out NAs, blanks, and the like), a simple enough proposition, I think:
Row Labels: course_id
Column Labels: gender
Values: course_id (Count; show as % of Row Total)
I get

Pretty striking, I’d say. Even as the cumulative female presence fills but a hairsbreadth more than a quarter of the MOOC virtual seats (again, these are per-course data; many students have booked multiple courses), the variation is end-to-end, streaking from a nadir of 5.55% for MIT’s 2.01x – Elements of Structures class (sounds like a course on Lego to me), to an acme of 49.23% for Harvard’s pH278x – Human Health and Global Environmental Change section. The numbers and the disparities clearly mean something – after all, the MOOCs are student self-selected – but the interpretations require some care, textured by the understanding that the course types themselves impose a skew on the findings.
Now if you want to heighten the granularity to the university level – that is, gather figures on enrollments by school, of which there are only two here, of course – we’ll need to derive those data formulaically, by dislodging the school names from the course_id contents into a new field. We want then to see “Harvard” in splendid isolation in that field, and not HarvardX/CB22x/2013_Spring, for example. My idea: cell-point to the nearest free column – for me, U – name it Institution, and enter in U2:
=IF(LEFT(A2,1)=”H”,”Harvard”,”MIT”)
That elementary expression buys into the either/or condition of the university names. If the leftmost character in A2 is H, that yield inarguably stands for Harvard; anything other than H and the school has to be MIT.
Copy the formula down the column and lower a Copy > Paste Special > Values atop it all in order to free up a byte or two. Now try something like
Row Values: Institution
Column Labels: gender
Values: Institution (Count)
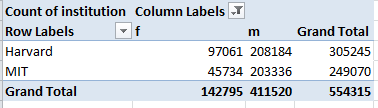
What’s noteworthy and by no means expected (for me at least) is Harvard’s overall enrollment edge, in view of the fact that its five courses are far outnumbered by MIT’s eleven. Turn the Count into % of Row Total terms and:

A spacious inter-institutional gender gap yawns before us like a somnolent student (again, you don’t need grand totals here. You’d probably want to center the row labels, too). There are assumedly some provocative things to be learned here, over and above the near-tautological aside that women seem to prefer the Harvard courses.
And we could ask if age differentials mark the Harvard/MIT divide as well. Remember that we’re working with EdX’s native workbook now, and so we need to eliminate the NAs and blanks from the YOB field here too. As per the earlier precedent we could run a Find and Replace on the NAs, with 2013 standing in for them. The blank cells here, however, need to be treated differently. Remember that our first Find/Replace go-round had to replace cell entries that actual read (blank), because these were the copy-and-pasted outcomes from a pivot table, in which wholly blank cells are indeed labelled (blank). But the EdX data records blanks with nothing; those cells are…blank. Find and Replace here thus necessitates absolutely placing nothing in the Find cell – but that also means that you can’t kick off the Find/Replace by simply clicking the I column heading and going ahead. That rudimentary act would select all 1,000,000-plus cells in the column, hundreds of thousands of which are blank, of course, and which would receive a 2013 in turn, even as they have no relation to the MOOC data. The tack then is to click in the Name Box and type I2:I641139 and click Enter selecting those and only those cells associated with the student records. Then Find cells bearing nothing, so to speak, and replace these with 2013.
Anyway, folks, when the priming is done you can try this:
Row Labels: YoB (again, grouped by three-year spans, after which the post-1999 bins are filtered, as before)
Column Labels: Institution
Values: Institution (Count, % of Column Total)
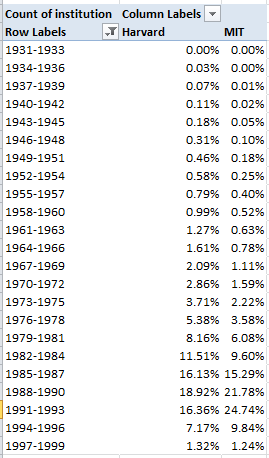
Look closely and you’ll find meaningful heterogeneity across the schools. MIT students appear to be younger, as well as more overwhelmingly male; 72.89% of them were born in 1985 or later, but the like figure for Harvard is 59.98%. Different courses, different course populations.
All of which means I think we need a Part 3.

Leave a comment