They’ve opened their data in Canada, too, right here; and with many of the holdings committed to XLS/CSV mode you’ll have plenty to do if your investigative interests take to you to the northerly latitudes (but don’t be fooled by my facile directional allusions; here in London we’re hundreds of miles closer to the Arctic circle than Montreal).
In the course of a preliminary poke through the site’s shelves your trusty mystery shopper slid this item into his bag (not to worry – I paid for it):
English-French bilingualisms by different geographies
a census of French, English, and French/English speakers in that officially multi-lingual part of the world. (And you may want to think about the workbook title.)
The workbook exhibits a number of organizational curiosities, some of which we’ve seen before, more or less; but however familiar, they beg our attention.
First note the bipartite headings overlooking the data set’s fields, spurious tandems clearly forced upon the data by Canada’s determinedly bilingual stance; but politics aside, the stacked pairs cause problems for the data. You can’t have two field headings in two rows; the lower of the two will be treated as a record, for filtering, sorting, and pivot tabling. Couldn’t a unified heading have been agreed upon, e.g. nom géographique, anglais/geographic name, English for column A (and you’ll note the apparently misspelled “georaphie” in columns C and D)? Whatever the strategy, one of those rows needs to be deleted.
Now observe columns A and B, and follow with an additional look at C and D. It appears as if these twosomes comprise the same information, albeit in translation. That is, B furnishes a French rendition of the corresponding data in A, and nothing more – and D does the same for C. Again, politics have trumped design considerations here, because the data are overwhelmingly identical across the fields; indeed, scan the twinned cells in A and B and you’ll discover that only 37 of the location names are spelled disparately across the two languages – and that’s out of 4982 records.
And how do I know that, by the way? I’ve been so informed by the simple, neglected, and nifty Row Differences feature housed in the Go To dialog box, just an F5 away. Select columns A and B, tap F5, click the Special… button, and tick Row Differences:
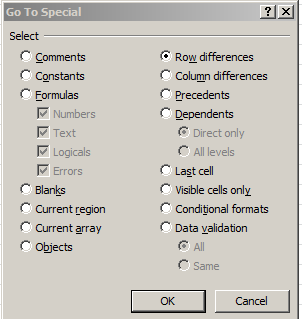
That swift routine selects all the rows in which the A and B data don’t agree.
But at least these excesses perpetrate no substantive injury upon the data – because, for example, any pivot tabling of the records need simply call upon the fields expressed in your desired language, and just as simply ignore the others. Nevertheless, mark the all-but-redundant fields as one of those organizational curiosities.
But the next curiosity is injurious indeed, and is visited upon the selfsame fields above. The data set has inflicted a massive, repeated double count of the numbers, by recurrently conflating concentric territorial levels among the records. That is, by insisting on aggregating the data by different geopolitical strata – all in the same data set – the same numbers get counted over and over as a consequence, and we can’t really have that, can we?
For example, the totals associated with very first data row – identifying Canada nationwide – post a collection of what are in effect grand totals, broken out into the various lingual distributions. Thus the census reports that 28,360,245 Canadians all told speak English – but of course that very number is variously subdivided among the subsequent records. As a matter of fact, if you simply sum the values in the L (speakers of English or French) field, the total – a nice round 283,695,000 – rather enormously overstates Canada’s demographics, and by a factor of about eight. And the problem is bewilderingly compounded by row 315, which nearly precisely duplicates the data in that first row.
But a reasonably satisfactory way to sift the jurisdictional apples from the oranges is at hand. By initiating a pivot table and swinging the georaphie [sic] type, English field (I’m working with the English field titles) into a Slicer and ticking, by way of illustration, Canadian Heritage region, and loading the Values area with speakers of French and speakers of English, you’ll get

The resulting breakout captures the true respective populations, because we’ve confined the analysis to just one of those geopolitical levels. Click province this time in the Slicer and you should see

Note the equivalent grand totals. Again, by cordoning ourselves into only one demo-stratum we’ve again isolated the proper national figures (although note that that clicking the census metropolitan area item cedes smaller numbers, presumably because those data devote themselves to larger Canadian urban areas only and not all localities in the country).
A few other clarifications need be issued. First, don’t be confused by the relation between the speakers of English, speakers of French, and speakers of English or French fields. The first two don’t add up to the third because the intervening field, English-French bilinguals, counts Canadians whose proficiency is also enumerated in by the speakers of English or French. Thus, for example, this formula:
=I3+J3-K3
should return the value in the L column.
But if you’re looking for a full-bodied denominator that would allow you to figure the percent of English or French speakers as a fraction of the all denizens populating each row you need to add the respective L and M values, the latter field subsuming Canadians who speak neither English nor French. The problem – though granted, a far smaller one than the multi-strata cohort complication we described above – attaches to the more than 3,000 hyphens jamming the far left of scads of cells in the M column. These may signify NA, data-not-available counts, but very well might, given the smallness of the row populations, simply stand for zero. Either way, a simple find and replace should palliate the problem – once you realize that the actual entries in the relevant cells are [space]-[space][space][space]. Nail that down, name column N All, enter
=L3+M3
in N3, and you would appear to be in business. You could then advance to a series of pivot table aggregates by this or that level, e.g.
Slicer: georaphie type, english (select say, province)
Row Labels: geographic name, english
Values: speakers of English
All
And in order to develop a province English-speaking aggregate, try this calculated field (which I’ve called Engsp):

I get
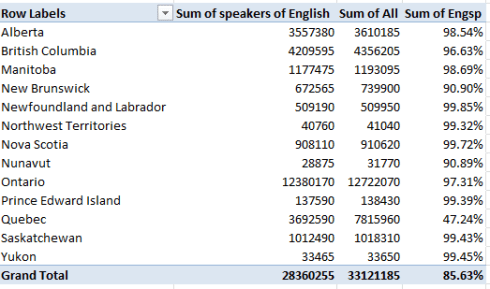
Note the smallness of the Quebec proportion. C’est tout.
Now does that make me a speaker of English and French?

One Response to “Canadian Bilingualism Data: Comme si, comme ca”