You’ve probably haven’t terribly much about Ebola lately, and that is all to the good. The disease’s disappearance from the headlines has everything to do with the extraordinary, near-total defeat of the African scourge, a triumph leaving the fifth estate with nothing to report.
But data about Ebola remain on hand, notably on the Humanitarian Data Exchange (HDX) site, a venue to which we’ve turned in the past for information about the epidemic when the situation was considerably more parlous. One of the holdings of epidemiological note comprises a spreadsheet-driven compendium of survey data elicited from respondents in the Liberian capital of Monrovia between December 2014 and January 2015:
With 75 fields the data set is decidedly multi-variate, and you’ll want to turn to this clarification of its fields for some deep background:
You’ll also probably want to autofit the sheet’s columns and delete the empty SURVEY_INFO field in A, its heading serving in effect to merely title the actual survey. And in fact the BACKGROUND name in F appears to do nothing more than partition two phases of the survey’s questionnaire from each other, corresponding to the darkened row 4 in the Survey sheet. Indeed – that color code of sorts on the survey sheet references similarly blank phase-separator fields in columns P, AJ, AX, and BR; as such they could all be escorted away from the data set.
But I said could, not must; and that’s because, data lacunae notwithstanding, none of these fields do any appreciable harm to the data set and its pivot tabling prospects. It suffices for a field to merely declare its heading, even as its cells beneath remain closed to entry. Type a heading and you have a field. The fields are purposeless, to be sure, but a pivot tabler need simply exercise his/her discretionary powers to ignore them.
And once you’ve finalized that design decision you can move on to some more conventional and substantive considerations. I’m generally a pushover for date/time fields whose contents are truly dates and times, and the cell holdings in the esdate parameter in the B column qualify, in each and every of its 1572 rows. But the informational gain in drilling down or grouping interview dates and times is uncertain; what, for example, might we learn from the available fact that more interviews were conducted between 11 and 12 in the morning than during any other hourly stretch? Not a great deal, I suspect.
But there are of course other findings to be found. A simple pivot table assay of gender:
Row Labels: Gender (filter the 10 blanks)
Values: Gender (% of Column Total)
Tells us that 55.38% of respondents were women, a disproportion that raises the usual sampling questions (some of which are considered by HDX here. The Liberian sex ratio verges on 1-to-1, by the way; see this page).
Then direct the religion field to Column Labels (and turn off Grand Totals for columns. Note the percentages read down the columns):
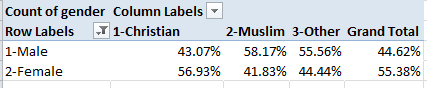
Why male Muslims predominate among that faith’s sub-sample presents itself as a question – a good question – that I can’t answer, though the absolute Muslim total – 153 – is overwhelmed by the precisely 1,400 Christian respondents (the Other field comprises 9 respondents).
You also may want to do some thinking about the ehowget field, once you understand what it’s saying. Its associated survey question asks respondents to identify the ways in which they believe Ebola could be contracted – but It doesn’t assume the respondent had incurred Ebola, as I had originally supposed. Put that clarification in place and we see 126 causal permutations, along with 25 Others and 144 Don’t knows. (Code 3 appears truncated among the data, and reads in full Body fluids of infected person. And code 6 has lost the e in “surface”.) Because so many of the replies cite multiple causes, the data scan less than tidily; but even if we were to number the permutation proxies 1 through 126 in the interests of brevity, that retouching would be presentational, and not substantive; those numbers would remain incomparably nominal.
What could perhaps be brought to these data is a count of the number of times each causal attribution appears among the responses, e.g., the frequency with which “6-Contact with infected surface” is alleged as at least partially contributory. Here good old COUNTIF can be pulled off the shelf and put into useful service.
First, I named the ehowget range in Q2:Q1573 causes, and then settled into a blank cell, say BZ1. Here I’d enter 1- , the reference for the Vomiting symptom, including the hyphen in order to ward off any other 1 that might, for whatever reason, have found its way elsewhere in the cell. I’d then enter, in CA1:
=COUNTIF(cause,”*”&BZ1&”*”)/COUNTA(cause)
We’ve been here before, and not so long ago, where I explained the workings of the above expression. The divisor realizes the proportion of all responses featuring coded symptom 1, 34.92%. I then entered 2-, 3-, etc. down BZ and copied the formula accordingly down CA. I get:
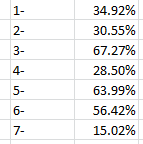
We see that codes 3 and 5, bodily fluids of infected person and touching dead bodies respectively, were most widely held by respondents to be implicated in Ebola transmission, at least in part. Code 7, Mother breastfeeding her child (that phrase also truncated in the data set) received the fewest attributions. Now one could go ahead and apply the same formulaic treatment to the next field, esignsymptom in R – that is, as detailed in A17 of the survey workbook, How can you know that someone has Ebola?
But take heart – it’s all past tense.

Leave a comment