As of this writing 2633 days have elapsed since Barack Obama at last received the go-ahead to bring about the change he thought we needed, and toward that end he’s proposed 1607 appointments to his administration, or one every 1.64 days.
That’s a lot of change, and some bright young things are doing a whole lot of background checks besides. And if you want to see if someone has snuck your name into the nomination pool you can make sure by downloading and vetting the
https://open.whitehouse.gov/dataset/The-White-House-Nominations-Appointments-New-/nmc8-q2uj
workbook sourced in the https://open.whitehouse.gov/ site, a none-too vast holding area for 27 datasets that’ll doubtless, eventually, have more to offer.
But what the appointment data has to offer is pretty interesting all by itself, once you’ve instituted the change you need – namely an autofit of the columns. For one obvious but enlightening take, we could pivot table a count of nominations by agency (note that nominations among the data run through March 3 of this year):
Row Labels: Agency Name
Values: Agency Name
Sort the results, and you’ll learn that more than 22% of the appointments were earmarked for the Federal Judiciary:

Dotting that roster are the two Obama Supreme Court nominees, Elena Kagan and Sonia Sotomayor (but not current nominee Merrick Garland).
And an equally unassuming table:
Row Labels: Name
Values: Name (Sort these highest to lowest)
will shuffle those 1607 into 1542 actual individuals, 56 of whom were thus nominated at least twice. The most peripatetic, current Secretary of Treasury Jacob Lew, turns up in the data set five times, though four of the mentions, for United States Governor (not to be misconstrued for the elected head of one of US’ fifty states) appear to have been simultaneous.
As for the timing of appointments, a simple consideration of the numbers by year should tell us something about the pace of nomination activity, along with perhaps the trajectory of position availability:
Row Labels: Nomination Date (the three blanks could be filtered)
Values: Nomination Date (grouped by Years)
(Note: Excel 2016 – which I’m currently using – will automatically group these data by Months, Quarters, and Years, whether you want it to or not. Clicking the ungroup button will return the data to the old default, by which each date staking the field will be uniquely cited.)
I get

Even given its rough distributional curve the numbers nevertheless skew indisputably across the second half of Obama’s tenure, that yet-to-be-completed interval accounting for more than 58% of all of the president’s appointments. Explanations, anyone? Again, those ups and downs may merely transcribe a record of as-needed, emerging position vacancies, but that one’s a call for the pundits, or maybe the statisticians. (And don’t ask me to explain why Excel saw fit to discharge its Show Values As button from its PivotTable Tools > Analyze ribbon. A space-saver? Not a time saver. Show Values As is available on the shortcut menu that a right-click atop the data will summon, though.)
And if you were thinking of grouping the years above into 2009-2012/2013-2016 shares, start rethinking. Clicking the standard pivot-tabling Group Selection option yields, not unexpectedly:
(Again, Excel 2016 defaults to that triple-parameter selection.)
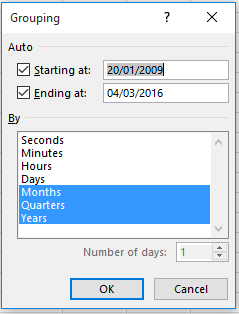
What’s missing of course is the By field that makes itself available to conventional number grouping, e.g.:
Work with dates, however, and you don’t seem to able to get to that screen shot from here. The simplest (though not necessary the only) way out: Entitle the free, adjacent column J Year and enter in J2:
=YEAR(E2)
Copy down J and four digits’ worth of years resolve into their cells. But those yearly representations – 2009, 2010, etc. – are not bearers of the date-formatted quantities you may think they are. Format 2009 in date mode, for example, and what you get is January 7, 1905 – because that date stands 2009 days away from Excel’s date baseline January 1, 1900, the point of embarkation against which all subsequent dates are counted. January 1, 2009, on the other hand, is the number-formatted 39814 – its distance in days from the baseline. Bottom line, then: the YEAR function returns a useful number – but one that doesn’t return the year in its real, sequential space.
In any case, once the stand-in dates take their place in the J column you can move to this pivot table:
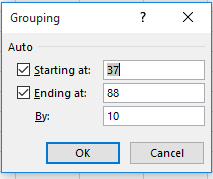
Row Labels: Year (Filter the 1900, signifying blank cells. Group thusly, overwriting the 1900 in the Starting at field to 2009:

Values: Year
I get
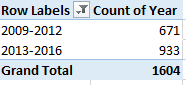
That’s what I was looking for.
And given the data’s bookended Nomination Date and Confirmation Vote fields, we should be able to say something about the average wait time between a nominee’s submission and disposition, once we acknowledge the latter field’s 179 blank cells (one assumes at least some of these denote pending candidacies – and you can get 179 by trying =COUNTIF(G2:G1608,””) ). Of course the AVERAGE function ignores blanks, and so these ciphers won’t impact the calculation.
The by-the-book answer to our wait-time question would have us mark out a new field in K, call it something like Vote Wait in Days, and enter in K2
=IF(COUNT(E2,G2)=2,G2-E2,””)
While one could entertain alternative logical tests, this one above upon me first. The expression asks in effect if both a record’s Nomination Date and Confirmation Vote fields are filled; if so, a simple subtraction of the earlier from the later date follows. If not, the cell receives nothing (and yes, it would be possible to simply omit the if false condition entirely from the formula, whereby any cell’s failure of the logical test would return the Boolean FALSE in the cell; but remember I’m trying to go by the book).
Copy that expression down K, and simply write, somewhere,
=AVERAGE(K2:K1608)
And you should realize an average nominee wait time of 143.35 days. You could then arrange this pivot table:
Row Labels: Agency Name
Values: Vote Wait in Days (Average)
Among other things you’ll meet up with ten agencies whose blank cells have inflicted a #DIV/0! alert upon their breakout, but if you sort the averages Highest to Lowest you’ll restore some visual order to table; and by doing so you’ll observe considerable variation in the wait times, while granting that the agency numbers can be very small.
But I had another idea – to devise an array formula, a one-celled power expression that would yield that same 143.35. Now because array formulas often model themselves after the syntax of the standard, record-by-record expressions such as we composed above, I originally advanced this follow-on:
=AVERAGE(IF(COUNT(E2:E1608,G2:G1608)=2,G2:G1608-E2:E1608))
In fact this formula looks a good deal like the record-specific
=IF(COUNT(E2,G2)=2,G2-E2,””)
That we drew up above, a formula that worked. Here in the array context all the counts and subtractions operate on ranges, or arrays, but these are placed in the same relation as in the earlier conventional formula, with the AVERAGE function bracing the whole thing.
But my array formula didn’t work, (apparently) because this segment
COUNT(E2:E1608,G2:G1608)
subverts the array dynamic between the E and the G arrays, by dint of the trifling comma that seems to have split the two apart. That sabotaging detail dragged me to a Plan B:
{=AVERAGE(IF(E2:E1608+G2:G1608>E2:E1608,G2:G1608-E2:E1608))}
This one works, and it works by restoring an operational relationship between E2:E1608 and G2:1608, one that satisfies the array formula’s peculiar processing needs. The formula in effect asks to average the wait times of rows in which its summed E and G entries exceed the entry in E – another way of asking if there’s anything in G.
It works, and I’m floating my name for that open Ambassador to Redmond position.

Leave a comment