You’ll want to read the fine print attending Vice.com’s database on US police shootings perpetrated between 2010 and 2016 for the country’s 50 largest police departments before you turn to the data themselves here, having been exported into Excel via its native Google sheet:
That expository lead-in on the Vice site recounts the provenance of the data, the mixed cooperativeness of departments Vice encountered when requesting incident information, and some of the coding decisions that shaped the workbook as it has emerged. In fact, Vice reports the figures for 47 police departments and for what it tabulates as 4,099 episodes, though the data set itself comprises 4,381 records. That discrepancy may owe to the fact that Vice appears to have assigned one record to each civilian party to an incident, even if multiple civilians were participative (note the NumberofSubjects field in column B records 1 for each row; that unrelieved redundancy suggests the field is dispensable).
Of course, the spreadsheet can’t tell us what truly happened in any of these 4,000-plus episodes, but that should discourage neither Vice nor us from evaluating its contents; but as usual, those contents need be adjudged for their data-worthiness first.
And a few judgements need to be made about some authentic issues. When I attempted to sort the NumberofSubjects field I was detained by this message:

In other words, some merged cells have edged their way into the set, congesting the sort prohibitively. The swiftest means for unmerging (lovely Microsoft verb) the culprit cells: click the empty Select all button to the immediate left of the A column header, thus selecting the entire sheet, and click Home ribbon > Unmerge Cells, the final option waiting behind the Merge & Center button in the Alignment group. (If you need to learn the specific addresses of merged cells, look here. The merged-cell adulteration is particularly pronounced among the data for Austin, Texas, by the way, these commencing in row 105).
There’s more. My customary date-validity check of the Date field, i.e. submitting a =COUNT(A2:A4382) formula to the column in search of a total of 4381 – the count of entries in the range that would roll up should all of them prove to be numeric – presented me with 4355 instead, netting, or nettling, a shortfall of 26. And that means that 26 date bluffers – textual flim-flammers hoping to con you and me into believing they’re for real – are up to no good somewhere in there.
If you click in an actual date in A and sort the date data Oldest to Smallest, those scruffy 26 settle to the bottom of the field. They’re all phrased in European regional syntax (dd/mm/yyyy) (as they are in the native Google Sheet), and they all emanate from Baltimore County, as it turns out. But origins aside, their numeric character needs to be reclaimed.
Something you can do, then: clamber into Q4357 – the next free cell in the first row bearing the phony dates – and enter:
=DATE(RIGHT(A4357,4),MID(A4357,4,2),LEFT(A4357,2))
DATE is the function that gathers individuated year, month, and day references and compounds them into a usable date. Here I get 41134; format the result in Short Date terms (use the Number format dropdown in the Number button group) and you wind up with a for-real 8/13/2012. Copy down Q, then Copy > Paste Value the results to A4357:A4382, and format accordingly (and now delete the Q data).
That works, but now ride the elevator to A2 and consider the value – and it is a value – that sits in that cell. That 2010 you see is not some stripped-down cipher for a fuller expression, e.g. 6/5/2010. Rather, it’s nothing but, and only 2010; and if you format those four digits into Short Date terms you get 7/2/1905 – which after all, is the 2010th day distanced from Excel’s date baseline of January 1, 1900. Without the supplementary day and month data, that 2010 won’t be transposed into anything later in the calendar, and there are 593 cells in the A column – or 13.5% of all of its holdings – comprising four-digit entries that won’t evaluate to anything like the years they purport to portray. And even if you pivot table the dates and hope to pivot them by year only, that won’t work.
These four-digit discordances inflict both a spreadsheet and a journalistic/ethical problem of sorts upon the analysis. The former is spoken to above, but the latter asks about a workaround. What can we do with these data? If we adjoin some place-holding day-month place holder – e.g. 1/1 to the numbers in the interests of lifting them to usability, is that something we’re allowed to do? Perhaps we could, if we indeed want to group the dates by year, and only by year. In that case, since our singular interest is in grouping the years that we in effect already know, any fictional days and months would play a merely technical, facilitating role in reconciling all the year data to the table. But ascribing any substantive role to the days and months, e.g., grouping the data by the latter parameter, would appear to abuse the system.
If that rationale is deemed supportable, we could then remake the 2010 in A2 via
=DATE(A2,1,1)
And do the same for its fellow 592 cells (followed by Copy > Paste Values and reformatting to Short Date). Complete that task and you could engineer this pivot table:
Rows: Date (grouped by Years only)
Values: Date (Count)
I get:

The preliminary count points to a marked diminution in police shootings since 2013 – encouraging, perhaps, but a suggestion that needs to be inspected for the completeness and comparability of the data across the 2010-2016 span.
Now if you want to enumerate shooting incidents by city – an aim bulking high on any investigative agenda (factoring population size, of course) you could proceed here:
Rows City
Values: City (Count)
The values could be sorted Largest to Smallest. I get, in excerpt:
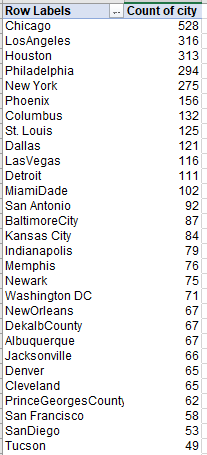
Chicago – a city less than half as populous as New York – records a surpassingly high incident total, in fact accounting for 12% of all the reported shootings among the cities. The city’s spike in gun violence has been no stranger to media coverage, and so resort by the police to that weapon is not shocking in and of itself. Return Date to the pivot table, this time to the Columns area, and

Note Chicago police have actually pulled back on gun interventions (but note the missing data for Detroit for 2014-16, contributory in part to the lowered recent numbers).
One other point, here: I think the BaltimoreCity/BaltimoreCounty and MiamiDade/City of Miami entries are properly distinguished, and not instances of spelling inconsistencies. But there are other data issues, too.

One Response to “US Police Shooting Data, Part 1: A Civilian’s Review”